Bitcoin Price Technical Analysis for 29/1/2015 - Bearish Wave Subsides Soon
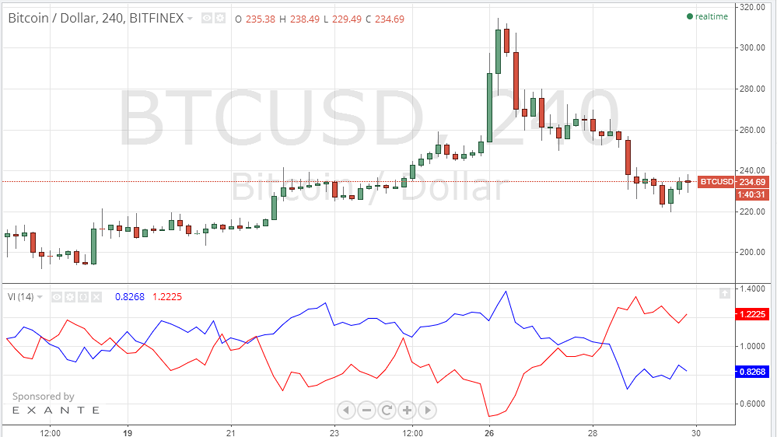
Bitcoin price fell to test the $230 support line yesterday, yet the $230 line seems to support the price well, as the price started rising again after testing the $230 support line to score around $237 at the time of the writing of this article. By studying the 4 hour Bitfinex (BTC/USD) chart from tradingview.com and plotting the Vortex Indicator (VI) (look at the below chart), we can notice that the red downtrend line is still above the blue uptrend line, which is synchronizing with the current bearish trend. Reversal of the bearish trend will be inevitable when we can see:4 or more....
Related News
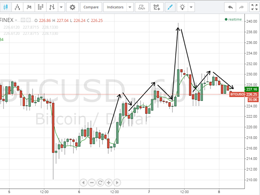
Bitcoin price advanced to around $240 today after we spotted a bullish wave which started yesterday. Today's bitcoin price increase is highly considerable given the bearish wave that has been dominating the market throughout the past 2 weeks. By studying the 1 hour Bitfinex (BTC/USD) charts from tradingview.com (look at the below charts), we can notice that today's trading led to a repetitive pattern of candlesticks. 3-5 green bullish candlesticks followed by 2-3 red bearish candlesticks which is a pattern that has been pushing the price upwards earlier today. Each bullish wave is followed....
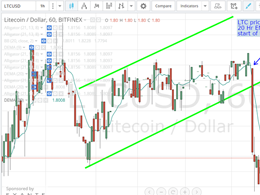
Litecoin price dropped yesterday to record a low of around $1.78. The bearish wave coincided with yesterday's bitcoin price drop. If the price fails to push up above $1.85, we can see litecoin price drop to even lower levels. By studying the 1 hour Bitfinex (LTC/USD) charts from tradingview.com, plotting the 20 hour EMA and keeping the trend line we plotted throughout our yesterday's analysis (look at the below chart), we can conclude the following: Litecoin price dropped below the 20 hour EMA just before the bearish wave took the price down to $1.78. The price has broken out of the....
Bitcoin price increased today, just as our analysis from yesterday predicted, reaching a high of $242.54; so, we are expecting a continuation of this bullish wave to take the price up to $300 during the next few days. By looking at the 1 day Bitfinex (BTC/USD) charts from tradingview.com and drawing a trend line between the high reached on the 13th of November, 2014 ($472.49) and the low reached on the 14th of January, 2015 ($167.05) and plotting the Fibonacci retracement fan accordingly, we can notice how today's trading pulled the price up to $242.54. The new bullish wave will likely....

Darkcoin price plunged yesterday to print a low of around 0.009762 BTC earlier today on Cryptsy. This bearish dive pulled darkcoin price well below the 50% Fibonacci retracement level at 0.010844 BTC, yet the following hours pushed the price upwards as now darkcoin is trading around 0.01066 BTC at the time of writing of this analysis. The fall in darkcoin price goes along the price drops of other altoins, such as dogecoin, in the face of the rising price of bitcoin. By studying the 1 hour Cryptsy (DRK/BTC) chart from bitcoinwisdom.com and plotting the 10 hour EMA (green curve) and the 20....
Bitcoin price remained above the $220 level yesterday, as the market's bulls failed to push the price up to test the $256 resistance level. By studying the 1 hour Bitfinex (BTC/USD) charts from tradingview.com, we can analyze the market's pattern throughout yesterday's trading sessions. We can summarize yesterday's trading trend by the following repeating pattern "A burst of a 3 hourly bullish candles is followed by a bearish weaker wave that takes the price down to abolish 50-70% of the bullish wave". The outcome of this pattern is an upward sloping trend line (look at the green trend....