Bitcoin Price Technical Analysis for 3/2/2015 - Pending Bullish Stampede
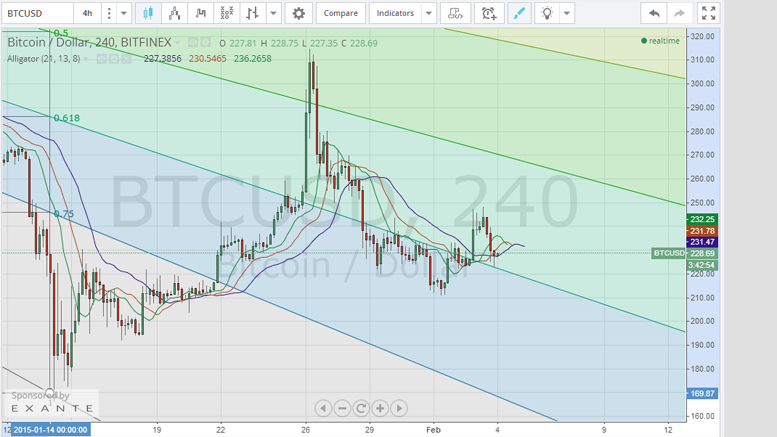
Bitcoin price started the day by rising from around $236 to more than $248 before a bearish downtrend pulled the price down back to around $226 at the time of the writing of this article. As the price is advancing, it's logical to see downward price movements as traders take the profit by closing their long positions. Although the bullish rally slowed down today, it's quite obvious that bitcoin price won't break the $200 support level, maybe because of the psychological makeup of the traders who think that a bitcoin is worth more than $200. By plotting the Fibonacci retracement fan on the....
Related News

Bitcoin remains at the same price level from last week, reinforcing the $600 support area for the entire new cycle. Meanwhile, technical analysis indicates that bullish consensus is getting stronger, increasing the likelihood of a rally from $650 to $820. 5th Elliott Wave forecasting, based on Fibonacci numbers, could be calculated to the technical objective around the $820 area, where several theories point to the delayed next stage. From there, a technical correction should send prices back to $700, giving stragglers a second chance to recalculate their strategies to join. After another....
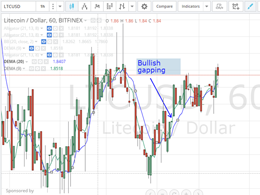
Litecoin price resumed its journey towards the north yesterday to score a high of $1.85. The uptrend continued to control today's market and litecoin price is trading at $1.86 at the time of writing of this article. By studying the 1 hour Bitfinex (LTC/USD) charts from tradingview.com and calculating the 20 hour EMA (look at the below chart), we can better understand the market's trading pattern. On the 19th of January, the bullish rally was rather strong leading to 4 successive bullish candlesticks on the 1 hour charts. Also, we can recognize "bullish gapping" i.e. the price opens at a....
Bitcoin price increased today, just as our analysis from yesterday predicted, reaching a high of $242.54; so, we are expecting a continuation of this bullish wave to take the price up to $300 during the next few days. By looking at the 1 day Bitfinex (BTC/USD) charts from tradingview.com and drawing a trend line between the high reached on the 13th of November, 2014 ($472.49) and the low reached on the 14th of January, 2015 ($167.05) and plotting the Fibonacci retracement fan accordingly, we can notice how today's trading pulled the price up to $242.54. The new bullish wave will likely....

In this episode of NewsBTC’s daily technical analysis videos, we take a look at the Bitcoin price rally to see if it can turn into something much bigger. Are bulls ready to stampede all over bears? Take a look at the video below: VIDEO: Bitcoin Price (BTCUSD): October 25, 2022 Crypto Winter Finally, some action in Bitcoin, and so far it is to the upside. Bitcoin price is testing just below $20,000 currently. Related Reading: Can Bitcoin Bring An End To Crypto Winter? | BTCUSD Analysis October 24, 2022 BTCUSD Daily Begins Potential Bollinger Band Squeeze This is particularly....

Bitcoin briefly topped $250 for the first time since August 19, 2015, hitting a fresh monthly high of $250.09. We concluded the previous Bitcoin price technical analysis Retreats From Monthly Highs on a positive note saying that market participants should not be concerned about the drop and instead go long in Bitcoin near $242 for a target of $250. As can be seen, Bitcoin hit an intraday low of $242.82 before meeting the said target. Bitcoin is currently trading at $248.81, up 1.92 percent. And yes, we stand by our long call! bitcoin price chart. Below are the latest technical....