
Bitcoin Price Technical Analysis for 12/2/2015 - Repetitive Pattern
Bitcoin price attempted to rise away from the $220 support level and the price recorded a high of $224.34 earlier today before trading sideways to $220 during the rest of the day. By studying the 1 hour Bitfinex (BTC/USD) charts from tradingview.com (look at the below chart), we can understand today's trading pattern. Bitcoin price increased from $220.73 to $224.34 before falling down again to test the $220 support level earlier today. The $220 support level reversed the bearish wave driving the price upwards again to over $223. At the time of the writing of this article, bitcoin price....
Related News
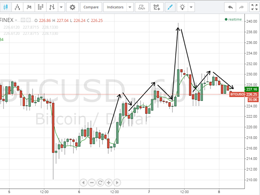
Bitcoin price advanced to around $240 today after we spotted a bullish wave which started yesterday. Today's bitcoin price increase is highly considerable given the bearish wave that has been dominating the market throughout the past 2 weeks. By studying the 1 hour Bitfinex (BTC/USD) charts from tradingview.com (look at the below charts), we can notice that today's trading led to a repetitive pattern of candlesticks. 3-5 green bullish candlesticks followed by 2-3 red bearish candlesticks which is a pattern that has been pushing the price upwards earlier today. Each bullish wave is followed....
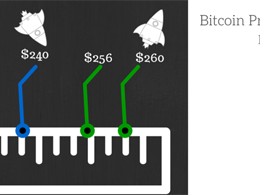
Bitcoin price is advancing according to our earlier analysis. The uptrend line that we spotted earlier today is continuing to tarmac the way to an even stronger bullish wave. As shown on the 1 hour Bitfinex (BTC/USD) chart from tradingview.com (look at the below chart), we can notice the shape of the bullish wave that has been ignited on the 16th of January. We can see a repetitive pattern characterized by a bullish rally that is followed by a 50-70% downwards correction force. The price seems to be heading up to the $256 resistance especially that the price is now above the 20 hour moving....
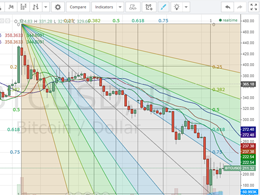
The price of bitcoin started the day by rising from $210 to around $219 and since then, it started a repetitive pattern by oscillating between $207 and around $215. By plotting the Fibonacci retracement fan on the 1 day Bitfinex BTC/USD charts from tradingview.com (look at the below chart), we can see the price advancing towards the 0.75 fan line, while gaining support at the 1.0 fan line. Bitcoin traded around $212 at the time of writing of this article and the market seems to me moving sideways in an attempt to correct the price. By plotting the MACD curve on the 1 hour Bitfinex....

Bitcoin price has slumped more than 3.5% bringing the bearish Head and Shoulders pattern to near completion. Bitcoin dropped from roughly $254 to $243 which is in close proximity to the target of $241.50. With this loss, the cryptocurrency has erased all the gains for the month of April. Each Bitcoin is currently worth $244. An analysis of the 240-minute BTC/USD price chart reveals that the damage has been done and the price may consolidate or rebound in the coming sessions. Head & Shoulders Pattern - Bitcoin had been forming a Head & Shoulders pattern - a technical bearish reversal....

Tired of Bitcoin's consolidation? Well, then there is good news! After spending considerable time in a contracting trading range, Bitcoin may well be on course to register another breakout. There is a significant probability that the breakout may be on the upside and lead to swift gains for the cryptocurrency. Bitcoin is currently trading at $244.42. Technical analysis of the 240-minute BTC-USD price chart conveys that the cryptocurrency is well poised for the next leg of its rally. However, the support of $240 must not be violated. Bitcoin Chart Structure - A quick glance at the....