Bitcoin Price Technical Analysis for 20/2/2015 - Rising Steadily
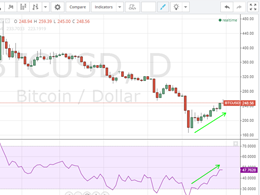
Bitcoin price continued rising yesterday from a low of $235.86 up to record a high of around $244. The new uptrend is steady and continued to push the price to higher levels earlier today reaching $244.4 at the time of writing of this analysis. By studying the 1 hour Bitfinex (BTC/USD) chart from tradingview.com and plotting the 20 hour EMA (look at the below chart), we can notice the following: The bullish wave that started on the 18th of January has gained strength during yesterday's later trading sessions, as shown by 2 bullish rallies, each consisting of 4 bullish candlesticks, on the....
Related News

The sharp jump in Ethereum to 0.0021BTC was due to a swift decline in bitcoin price from above-$440 to $410. But with bitcoin now rising to $424, Ethereum has slowly and steadily reduced the gains to 0.0020BTC. Therefore, I do not lay much emphasis on the fact that Ethereum has violated the downward trendline joining the peaks of the past two weeks. As bitcoin remains undecided about the future course of action, I do not expect major deviations in Ethereum as well. Now, let us take a look at the latest technical indications from the 4-h ETH-XBT price chart taken from KRAKEN exchange. Chart....

Bitcoin price continued soaring yesterday to print a high of around $299. The price has been increasing along the new rising trend line we spotted during Sunday's analysis. It seems that we will see bitcoin price exceed $300 within the next 24 hours, especially if the trading volume remains as high as it has been during the past 24 hours. By examining the 1 hour bitfinex (BTC/USD) chart from tradingview.com and plotting the 20, 50 and 100 period EMAs accordingly (look at the below chart), we can conclude the following: Since the beginning of March, bitcoin price has been rising along a new....

I will resume writing a daily LTC price technical analysis starting from today, so throughout this article, I will try establishing some key resistance and support points that would help us read through the charts and detect clues that can predict future price movements. Last week, LTC price surged to exceed $4 on the 31st of October. The bullish wave started a day earlier than Bitcoin's surge and Litecoin's price rose from $3 to around $3.72 last Sunday. However, as Bitcoin's price rose above the $340 resistance level, LTC also continues to print higher highs. Bulls in Control On 1 Day....
Bitcoin price continued rising, emphasizing the bullish wave that started earlier this week. Yesterday, the price pushed upwards until it touched the $256 resistance line. The price reached a high of around $259 yesterday, before falling to $249 at the time of writing of this article. Basic and technical analyses are in favor of continuation of the bullish trend to push the price even higher. By studying the 1 day Bitfinex (BTC/USD) charts from tradingview.com, we can notice a reversal of the bearish trend on the 14th of January. By plotting the Relative Strength Index (RSI) on the same....

Bitcoin price rose to print a high of around $298 yesterday, before declining to around $288, which touches the rising support level we spotted on Wednesday's analysis, earlier today. It seems like we are witnessing a "whiplash" downwards phase that proceeds a forwards phase that will lead to a breakthrough the $300 resistance level. By studying the 1 hour Bitfinex (BTC/USD) chart from tradingview.com and plotting the 20, 50 and 100 period EMAs accordingly (look at the below chart), we can conclude the following: Since the beginning of March's bullish trend, bitcoin price has been....