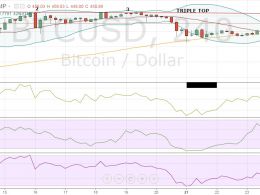
Bitcoin Price Technical Analysis for 18/3/2015 - Trapped Again!
Consistent with yesterday's analysis, Lackluster Moves, Bitcoin has been bogged down by profit booking and minor selling, and has reached the crucial Support Line 1. This support level has been reaffirmed several times before, and hence, any breakdown below this could lead to a free fall in the Bitcoin price. By technically analyzing the BTC/USD 240-minute price chart, my recommendation is to sell on the rise. Here are some technical considerations which push me to this conclusion. Lower Top Confirmed - The technical indicators had for long been pointing to a fading bullish momentum and....
Related News
An absolute calm has engulfed Dogecoin as the price remains trapped in a tight range of 50.8-51.9 satoshis. The market is severely testing the patience of the short-term traders, who now fear that a surprise breakout could trigger huge losses. The market may be waiting for a trigger to break free but until that happens, it would only be wise to trade the range with minimum quantities. Dogecoin price chart, Dogecoin analysis. Nothing much has changed in the past 24 hours in terms of price (the current value of each Dogecoin is 51.1 satoshis) but the chart structure has definitely....
In my yesterday's analysis, Trapped Again, I had mentioned that a breakdown below the $280-mark could lead to a free-fall in the Bitcoin price. Bitcoin cracked below $280 and is now roughly worth $250. The sudden collapse might have taken many by surprise, but the technical indicators were foretelling this. Now, the same indicators and the reformed chart structure are revealing some very noteworthy details. Bollinger Bands - The crash in Bitcoin price has severely stretched the Bollinger Bands on the lower end, which implies that a temporary support might set in soon. Fibonacci Retracement....
It has been six consecutive days since Bitcoin took a wide swing on either side. The price has been trapped inside a narrow of $273-283. Bitcoin is currently trading up 0.70% at $277.94. One thing that has happened for the bulls is that the technical indications have improved, but only very slightly. Among these, the Momentum reading which has been a strong reason to worry has shown a tremendous appreciation. Take a look at the technical observations drawn from the daily BTC-USD price chart below. Bitcoin Chart Structure - Consolidation in the cryptocurrency enters the seventh day as....
Bitcoin is trading relatively flat since yesterday as bulls and bears sweat it out to turn the battle in their favor. However, none of them has been able to make a considerable impact until now. Bitcoin dropped after hitting resistance, and the price took support from the recent low of $226.83. Bitcoin is presently consolidating near $228.57. Technical analysis of the 240-minute BTC-USD price chart confirms that the current scenario evenly favors both the bulls and the bears. Bitcoin Chart Structure - The chart above clearly tells that the cryptocurrency is trapped inside a thin range of....
The Christmas isn’t turning out to be merry for Bitcoin. The cryptocurrency is struggling near the overhead resistance of $465. It is now trading 1.28% lower at $450.89, raising concerns that the market participants might pull out their funds in the holiday season. As a result, several technical indicators are also showing declines. We advised in the previous Bitcoin price technical analysis Target Achieved that traders should book at least partial profits in their long positions. And for today’s analysis, we will again be using the 4-h BTC-USD price chart from BITSTAMP.


