Dogecoin Price Technical Analysis for 23/03/2015 - More Consolidation
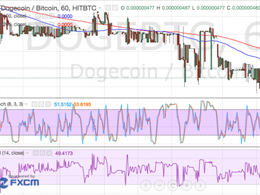
After a slight pickup in volatility last week, the dogecoin price settled back in its current range between 47 to 50 satoshis. The 100 exponential moving average (green) has held as resistance, indicating that the consolidation or longer-term downtrend might stay intact. Price hit resistance around 51 satoshis last week and proceeded to test the range support near 48 satoshis. Stochastic (8,3,3) on the dogecoin price chart from Hitbtc is between 60 and 80 and is moving down, indicating that selling pressure is building up. Further declines in the stochastic indicator could mean more losses....
Related News
The contraction in Dogecoin channel has limited the price movement from 46.6 satoshis to 48.3 satoshis - much narrower than the previous range of 46.6-50 satoshis. I had discussed the possibility of the consolidation extending earlier because neither of the parties is willing to exert force. The current value of each Dogecoin is 47.9 satoshis. Analysis of the 240-minute Dogecoin/Bitcoin price chart supports my earlier view that the consolidation may prolong. Bollinger Bands - The latest price contraction has witnessed Bollinger Bands playing a crucial technical role. As is evident from the....
An absolute calm has engulfed Dogecoin as the price remains trapped in a tight range of 50.8-51.9 satoshis. The market is severely testing the patience of the short-term traders, who now fear that a surprise breakout could trigger huge losses. The market may be waiting for a trigger to break free but until that happens, it would only be wise to trade the range with minimum quantities. Dogecoin price chart, Dogecoin analysis. Nothing much has changed in the past 24 hours in terms of price (the current value of each Dogecoin is 51.1 satoshis) but the chart structure has definitely....
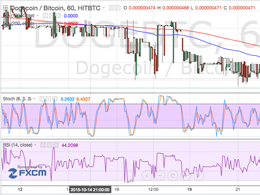
Dogecoin Price Key Highlights. Dogecoin price did indicate further downside momentum, as predicted in an earlier technical analysis write-up on the consolidation pattern repeating itself. With the downside break, more sellers could hop in the ongoing downtrend and push dogecoin price to new lows. Dogecoin price confirmed the buildup in bearish pressure with a strong downside break below the consolidation pattern on its 1-hour chart. Where To Next? Price has broken below the previous lows in October 21, hinting that bears are unstoppable at this point. Stochastic and RSI are both on the....
Dogecoin price remains grounded, oscillating between a thin range of 50.8-51.2 satoshis. The 20-4h simple moving average continues to be an unsurpassable hurdle for the Dogecoin as bulls choose not to make any moves in the absence of positive triggers. The current Dogecoin price is 51.1 satoshis, slightly below the upper range of 51.2 satoshis. As can be seen from the 240-minute Dogecoin/BTC price chart, the cryptocurrency is barely moving anywhere. Technical analysis also points to a continuation of the sticky consolidation in the near future. Bollinger Bands - The Bollinger Bands have....
Dogecoin Price Key Highlights. Dogecoin price is once again settling around the bottom half of its range visible on the 1-hour time frame, creating a mini-range just above support. This pattern has been seen in the past, with price favoring a downside break and further losses. Dogecoin price is currently stuck in a tighter short-term range but could be ready for a breach of support, as this has been the case in the previous consolidation. 100 SMA Resistance. Dogecoin price has made a quick pullback to the 100 SMA, which has served as a dynamic resistance area during the downtrend. This....


