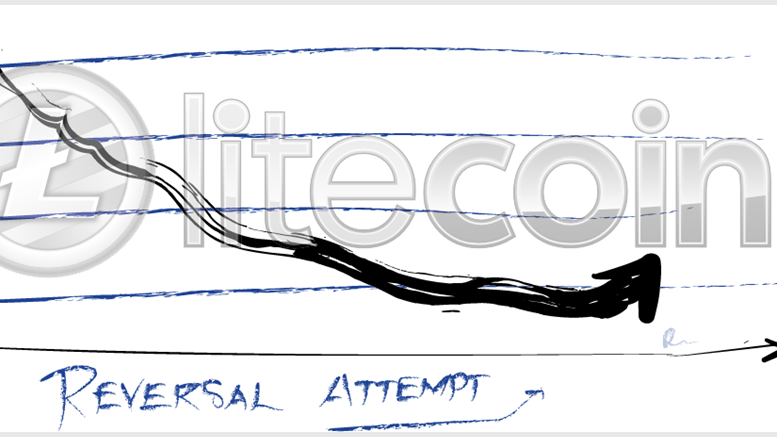
Litecoin Price Technical Analysis for 2/4/2015 - Reversal Attempt
In the 1H Litecoin chart, we can see a market that has been consolidating since last week when price action shook and created a range between roughly 1.61 and 1.81. Litecoin (LTCUSD) 1H Chart 2/4/2015. During this consolidation, price action has displayed bearish bias for the most part as ltcusd held under the 200-hour SMA, and for the most part under the 100-, and 50-hour SMAs as well. Meanwhile, the RSI has been holding below 60 after tagging 30. Now as we get into the April 2nd session, price has rallied above the 100-, and 50-hour SMAs and is now threatening the 200-hour SMA. Also,....
Related News

Litecoin fell more than 5 percent over the weekend as weakness returned to haunt the cryptocurrency markets. The Bitcoin market is also struggling to cope with the selling pressure and has returned to its crucial support of $220. Litecoin is currently trading at $3.330 and is well within its medium term trading range. In the previous Litecoin price technical analysis Sell on Rallies, we discussed how Litecoin remains weak and any rise in the valuation can be used to go short. That holds valid for even today. The latest technical indicators are nowhere positive or indicate that a reversal....

Litecoin bears have been smoked by the massive 27% rally in the past 24 hours following a high volume breakout from the range I discussed in my previous analysis, New Range. The surreal rise in Litecoin price has also pushed it to the highest level of 2015. Litecoin is currently trading at $3.871, a strong advance from yesterday's $3.047. Litecoin's jump to a fresh 2015-high closely follows Bitcoin's leap to a new June high, as the Greece crisis comes to its D-day. A technical look at the 240-minute LTC-USD price chart above tells that Litecoin has entered the "no-buy" zone due to its....

Litecoin has dropped 6.47 percent to trade at $2.733 as the underlying negativity comes to the fore. We discussed in the previous Litecoin price technical analysis The Pressure is Evident that there is a very low probability of the price trending higher and that bears may make an early comeback. This decline has also brought the price closer to its very important technical support of the 200-day simple moving average (SMA). The question that the trading community is now asking is: will this level cushion Litecoin once again? I continue to remain bearish on Bitcoin as well, which I believe....

In the previous Litecoin price technical analysis Flat Action, we discussed that if Litecoin fails to cross the resistance posed by the level of $3.160, it runs the risk of entering into a range. As can be seen, Litecoin has plummeted 4.44 percent to $2.907 as traders resorted to profit taking near the resistance. Another factor weighing on Litecoin is the weakness in the Bitcoin market. However, the good news is that Bitcoin is now close to its support level of $235. Values from the technical indicators overlaid on the daily LTC-USD price chart also suggest that there is an increased....
Litecoin is trading 0.31% or $0.014 down at $4.536 as selling pressure increases. While the price sustains above the support provided by $4.100, it may seem that a base may have been hit, but before establishing that we must take into consideration what the technical indicators are conveying. And I think they are pointing towards what was discussed in my previous analysis titled This May Turn Real Ugly! Litecoin Chart Structure - Litecoin has been repeatedly testing the support line but has failed at achieving a higher high on the rebound. The cryptocurrency is witnessing what is aptly....