
Bitcoin Price Technical Analysis for 16/4/2015 - Momentum Shifting
At the beginning of the April 15 session, we noted a bullish divergence in bitcoin, in the 1H chart. This is when price makes lower lows and the RSI makes higher lows. This does not always signal a reversal, but it reflects a slowdown in the bearish momentum and can often lead to some degree of consolidation if not bullish correction. Bitcoin (BTCUSD) 1H Chart April 16. The 1H chart shows that indeed after the 3-point divergence, price started to rally. Then, it failed to test the lows around 216-217 and held above 220 for the most part. By the start of the April 16 session, bitcoin....
Related News

Bullish bias is still evident in Litecoin even as the cryptocurrency fell sharply from 2.14 to 1.98. As discussed in yesterday's analysis, the recent correction in Litecoin presents to us an incredible opportunity to buy as the price structure strongly favors the bulls. Each Litecoin is currently trading at $2.05. A precise technical analysis on the 240-minute LTC/USD price chart indicates that the digital currency may have bottomed out and head higher to take out the 2015-peak eventually. Technically, Litecoin seems to be enjoying a positive undertone. Price chart and technical indicators....

In my previous analysis titled Wide Divergences, I had pointed out some eerie disconnects between the Bitcoin price action and the technical indications. It is highly possible that the price eased a little in order to properly reflect the underlying technical considerations. Bitcoin is currently trading down 1.32% at $275.99. However, I am very concerned about the incessant crash in the momentum reading, which is worsening by the day. A decline in the momentum value in flat trading cannot bode well for the long holders. Read below the technical observations of the daily BTC-USD price....

Trading with a slightly negative bias, Bitcoin has slipped to $244.28, down 0.94 percent yesterday. Even though the uptrend is intact, Bitcoin has failed to sustain above a key technical level which has led to severe deteriorations in the technical indicators. Let us discuss each of the factors in the technical analysis of the daily BTC-USD price chart below. Bitcoin Chart Structure - As has been marked in the chart above, the upward channel in which Bitcoin has been trading since the last week of September clearly holds. However, as discussed earlier, Bitcoin has failed to sustain above....
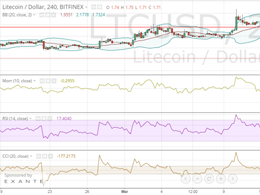
In yesterday's Litecoin analysis titled, Pressure Mounts, I discussed the possibility of the altcoin heading lower and recommended shorting. In the last 24 hours, bulls have been decimated as the value dived from $1.97 to a six-week low of $1.60. However, the price recovered to $1.71 as sellers booked partial profits. The crash in Litecoin price came in conjunction with an absolute slump in the Bitcoin price from $280 to $250. Bitcoin has routinely had a prominent effect on other cryptocurrencies. Technical analysis on the 240-minute LTC/USD indicates that the sentiment has turned strongly....

Yesterday, we noted that bitcoin started to coil within a consolidation range between roughly 236 and 256 as we can see in the 1H chart. Bitcoin (BTCUSD) 1H Chart 2/4/2015. During the first session of April, btcusd first extended a dip that cracked 240, but rebounded quickly back above the session high. More, importantly, the technical picture is shifting from neutral-bearish, to neutral in the near-term (1H chart). 1) BTCUSD is now crossing above the 200-, 100-, and 50-hour SMAs, which shows at least a loss of the prevailing bearish bias. 2) The RSI has pushed above the 60 level, which....