Litecoin Price Technical Analysis for 20/4/2015 - Resistance Holds
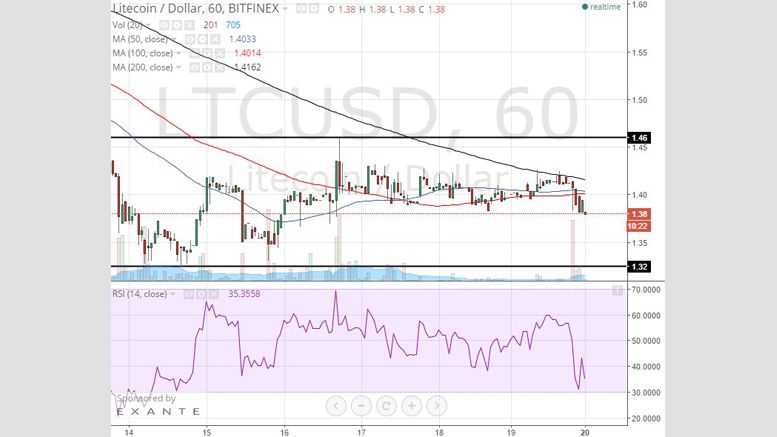
After making a low at 1.32 last week, litecoin has been in consolidation. The 1H chart shows the narrow consolidation range between 1.32 and 1.46. Litecoin (LTCUSD) 1H Chart April 20. Here are some observations from the 1H chart:1) The market has been relatively quiet over the weekend, but after price met with the 200-hour simple moving average (SMA), there was a bearish reaction. This shows that bears are in control. 2) The RSI shows a market in consolidation. It is now heading to 30, which could be a sign that the market is reviving the bearish momentum. If the RSI tags 30, and holds....
Related News

Litecoin falls 1.47 percent to $3.075 after kissing the resistance at $3.130. In the previous Litecoin price technical analysis, we said that Litecoin could leapfrog to higher levels on consistent support from the buyers, but what we have got instead is a bout of profit booking which once pulled down the price to an intraday low of $3.050. But can this decline prove fatal to Litecoin? Will the crucial support of $3.000 be breached? Let us try to find that out by conducting a technical analysis on the daily LTC-USD price chart. Litecoin Chart Structure - As can be seen, the higher top,....

Litecoin fell more than 5 percent over the weekend as weakness returned to haunt the cryptocurrency markets. The Bitcoin market is also struggling to cope with the selling pressure and has returned to its crucial support of $220. Litecoin is currently trading at $3.330 and is well within its medium term trading range. In the previous Litecoin price technical analysis Sell on Rallies, we discussed how Litecoin remains weak and any rise in the valuation can be used to go short. That holds valid for even today. The latest technical indicators are nowhere positive or indicate that a reversal....

Litecoin rises 2.92 percent to $3.098 as it breaks away from the consolidation phase which lasted for 7 consecutive days. This is also the highest closing level for Litecoin in over a month. The rise in Litecoin could also be partly attributed to a strong surge in Bitcoin on the back of a strong momentum breakout. Helped by the price jump, Litecoin is now in the sniffing distance of a crucial overhead resistance which we discussed in the previous Litecoin analysis In a Fix? Below are the latest technical considerations taken from the daily LTC-USD price chart. Helped by the price jump,....
Litecoin has been consolidating since finding support at 1.32 This consolidation follows a 3-point divergence between price and the RSI. Then, after a failed bearish attempt to test 1.32, price rallied again and rallied up to 1.46 before finding resistance. Litecoin (LTCUSD) 1H Chart April 17. In the 1H chart, we can see that there was resistance around 1.45-1.46, which was a common support from a previous consolidation. As price falls, we should watch what happens around 1.37. If ltcusd breaks below 1.37, it would break below the 100-, and 50-hour simple moving averages (SMAs) and this....

In the previous Litecoin price technical analysis Flat Action, we discussed that if Litecoin fails to cross the resistance posed by the level of $3.160, it runs the risk of entering into a range. As can be seen, Litecoin has plummeted 4.44 percent to $2.907 as traders resorted to profit taking near the resistance. Another factor weighing on Litecoin is the weakness in the Bitcoin market. However, the good news is that Bitcoin is now close to its support level of $235. Values from the technical indicators overlaid on the daily LTC-USD price chart also suggest that there is an increased....