Bitcoin Price Technical Analysis for 20/4/2015 - Triangle Support
Last week, bitcoin found support just above 216 and rebounded to about 230. After that, it ended the week with a bearish continuation attempt, which held back as it found support at a common support around 220. Bitcoin (BTCUSD) 1H Chart April 20. Here are some observations in the 1H chart: 1) Bitcoin Price is under the 200-, 100-, and 50-hour SMA, which means it still maintains a bearish bias as we get ready for another week. 2) The RSI has been oscillating between 30 and 70, which means there is no directional momentum yet. The fact that it is falling below 40 shows that the previous....
Related News
Since the last Litecoin price technical analysis Will This Support Hold?, Litecoin has gained $0.067 or 2.45 percent to trade at $2.800. The better part is that Litecoin is currently in a short-term technical pattern which will lead to a big swing in the price. Read on below the latest technical considerations of the daily LTC-USD price chart. Litecoin Chart Structure - Upon a closer look at the price action of the past 6-7 sessions, it can be found that Litecoin has been trading in a small triangle. A triangle, which is a continuation pattern, in a downtrend implies that a bigger downmove....
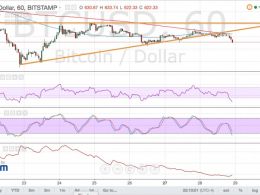
Bitcoin price broke below its triangle support to indicate that the selloff isn’t over yet. Bitcoin Price Key Highlights. Bitcoin price was trading inside an ascending triangle pattern as illustrated in a previous article. Price broke below support, indicating a pickup in bearish momentum and a likely drop to the triangle lows around $580. Technical indicators are also suggesting that further declines are possible. Technical Indicators Signals. The 100 SMA is below the 200 SMA so the path of least resistance is still to the downside. In addition, these moving averages held as dynamic....
Bitcoin price rose 2 percent to cross the $270-mark. I discussed in my previous Bitcoin price analysis titled Time to buy some that the cryptocurrency could stage a small comeback rally as technical factors played out. Bitcoin price touched an intraday high of $271.50 and is now trading at $270.22. Technical analysis of the daily BTC-USD price chart states that market participants should exit their long trades if the price were to rise further to $275-277. Bitcoin Chart Structure - The support of the descending triangle will now act as the resistance for Bitcoin. The downward sloping....
Bitcoin Price Key Highlights. Bitcoin price has been consolidating tightly inside a descending triangle pattern on its 1-hour forex chart, reflecting hesitation among buyers and sellers. The path of least resistance is to the downside since bitcoin price is coming from a downtrend and sellers appear to be pushing price gradually lower. Bitcoin price is approaching the peak of its triangle formation, which means that a breakout in either direction is imminent. Technical Clues. Bitcoin bounced off the bottom of the triangle quickly, as predicted in an earlier article, then went on to test....
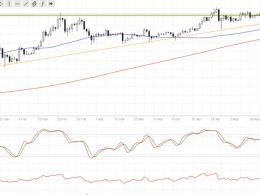
Bitcoin price is still inside its long-term triangle consolidation pattern and might make another test of the resistance. Bitcoin Price Key Highlights. Bitcoin price has formed higher lows and found resistance at the $470 level, creating an ascending triangle pattern on its daily chart. Price just bounced off the triangle support and is due for a test of resistance once more. Technical indicators are signaling that further gains are possible. Technical Indicators Signals. The 100 SMA is above the 200 SMA so the path of least resistance is still to the upside. A sharp move lower could find....

