Bitcoin Price Technical Analysis for 22/4/2015 - Uncoiling Upwards
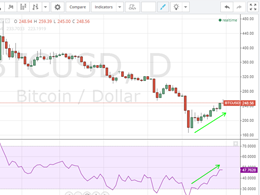
Since making a low on the month just above 216 bitcoin rebounded to 230 and start coiling as we can see in the 1H chart. Towards the end of April 21st session, btcusd started to uncoil upwards. Let's take a look at the charts: Bitcoin (BTCUSD) 1H Chart April 22. As we can see in the 1H chart, bitcoin not only broke above a triangle, it also charged above the 230 resistance. There was strong volume, and the 1H RSI popped up above 80. The price action suggests that the bullish breakout is very likely to extend. In the very near-term however, the RSI is overbought, so we can expect some....
Related News
Yesterday, we noted that bitcoin started to coil within a consolidation range between roughly 236 and 256 as we can see in the 1H chart. Bitcoin (BTCUSD) 1H Chart 2/4/2015. During the first session of April, btcusd first extended a dip that cracked 240, but rebounded quickly back above the session high. More, importantly, the technical picture is shifting from neutral-bearish, to neutral in the near-term (1H chart). 1) BTCUSD is now crossing above the 200-, 100-, and 50-hour SMAs, which shows at least a loss of the prevailing bearish bias. 2) The RSI has pushed above the 60 level, which....

In the previous session, we saw bitcoin uncoil upwards. In the 1H chart, we can see that the uncoiling extended further during the Thursday April 2 session. Here are some observations:1) Price has sprung up from the cluster of 200-, 100-, and 50-hour simple moving avearges (SMAs). This shows the market's decision to turn bullish. 2) The RSI has tagged above 70, which shows initiation of bullish momentum. 3) Price is still holding under the 255-256 highs, which suggests that the bullish outlook was so far a near-term one. Bitcoin (BTCUSD) 1H Chart April 3, 2015. Bullish Scenario: Now, if....

Darkcoin has failed to hold on to early gains and was last trading at 0.0109BTC. The depreciation in the value of Darkcoin can be attributed to the sharp rise in the price of the most loved cryptocurrency, Bitcoin. As Bitcoin continues to push upwards to cross $300, Darkcoin will feel the heat. Technical Check: Stay Cautious! A precise technical analysis on the daily DRK/BTC price chart, taken from www.bitcoinwisdom.com points to bearish connotations for the pair. Fibonacci Support - Darkcoin has deeply disappointed the investors ever since it peaked out at 0.016BTC in February. The pair....

Litecoin price ranged between $1.89 and $1.95 throughout yesterday's trading sessions. Litecoin charts seem to be mirroring what's happening on bitcoin's charts. Accordingly, it seems that litecoin price will likely rise especially that our bitcoin analysis anticipates a bullish wave during the next 24 hours. By examining the 4 hour Bitfinex (LTC/USD) chart from tradingview.com and plotting the William's Alligator indicator accordingly (look at the below chart), we can conclude the following: Since the new uptrend started pushing litecoin price upwards on the 27th of February, we have been....
Bitcoin price continued rising, emphasizing the bullish wave that started earlier this week. Yesterday, the price pushed upwards until it touched the $256 resistance line. The price reached a high of around $259 yesterday, before falling to $249 at the time of writing of this article. Basic and technical analyses are in favor of continuation of the bullish trend to push the price even higher. By studying the 1 day Bitfinex (BTC/USD) charts from tradingview.com, we can notice a reversal of the bearish trend on the 14th of January. By plotting the Relative Strength Index (RSI) on the same....