Dogecoin Technical Analysis for 18/05/2015 - Looks Set For a Break
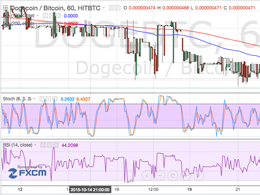
Key Highlights. Dogecoin continued to struggle around the previous swing high of 51.7. It is currently moving lower as forecasted in one of the previous analyses and looks set for a break in the near term. A pullback in Dogecoin is hard to consider as a reversal sign, as most technical indicators are still favoring buyers and more upsides. There is a crucial breakout pattern formed on the hourly chart of Dogecoin, as there is a contracting triangle shaped, and waiting for a catalyst for the next move. As of writing, prices are around the triangle resistance trend line and buyers are trying....
Related News

An absolute calm has engulfed Dogecoin as the price remains trapped in a tight range of 50.8-51.9 satoshis. The market is severely testing the patience of the short-term traders, who now fear that a surprise breakout could trigger huge losses. The market may be waiting for a trigger to break free but until that happens, it would only be wise to trade the range with minimum quantities. Dogecoin price chart, Dogecoin analysis. Nothing much has changed in the past 24 hours in terms of price (the current value of each Dogecoin is 51.1 satoshis) but the chart structure has definitely....

Technical analysis shows that Dogecoin is looking to break out from a key structure zone near $0.26, which could cause a change in market momentum. This technical outlook comes amidst a bearish week for DOGE, which has seen it breaking below support levels and erasing its gains throughout January. According to a technical analysis of […]
The Dogecoin price is gearing up for a significant break out to new upsides, as a crypto market expert shares a key technical analysis to support this prediction. The analyst believes that Dogecoin can skyrocket to $0.65 if it can maintain key support levels and avoid a further price breakdown. Dogecoin Price Set For $0.65 […]

Key Highlights. Dogecoin's price stayed in a range, and is now forming a contracting triangle on the hourly chart (data feed from HitBTC). There is a chance that the price may consolidate for some time before breaking in a direction, either up or down. Looking at the 2-hour chart (data feed from IO), a major breakout resistance is forming near 32-33 satoshis. Dogecoin's price is below the 100 MA (2H), which is discouraging buyers from taking it higher. A break above it may call for an upside move in the short term. What's next? Dogecoin's price continued to annoy traders, as there was no....
Dogecoin Price Key Highlights. Dogecoin price did indicate further downside momentum, as predicted in an earlier technical analysis write-up on the consolidation pattern repeating itself. With the downside break, more sellers could hop in the ongoing downtrend and push dogecoin price to new lows. Dogecoin price confirmed the buildup in bearish pressure with a strong downside break below the consolidation pattern on its 1-hour chart. Where To Next? Price has broken below the previous lows in October 21, hinting that bears are unstoppable at this point. Stochastic and RSI are both on the....