Dash Price Technical Analysis - Head and Shoulders Pattern in Making?
Key Highlights. Dash after trading lower found support around 0.0120BTC as forecasted in yesterday's post. It looks like it is forming a head and shoulders pattern, which might ignite a bearish wave in the short term. There are a few important things to note from the hourly chart of Dash, which points that if sellers gain control, more downsides are likely. Head and Shoulders Pattern. There is a monster support around 0.0120BTC, which acted as a barrier for sellers. Dash is currently moving back higher, but buyers need to be very careful as it looks like there is a chance of Head and....
Related News
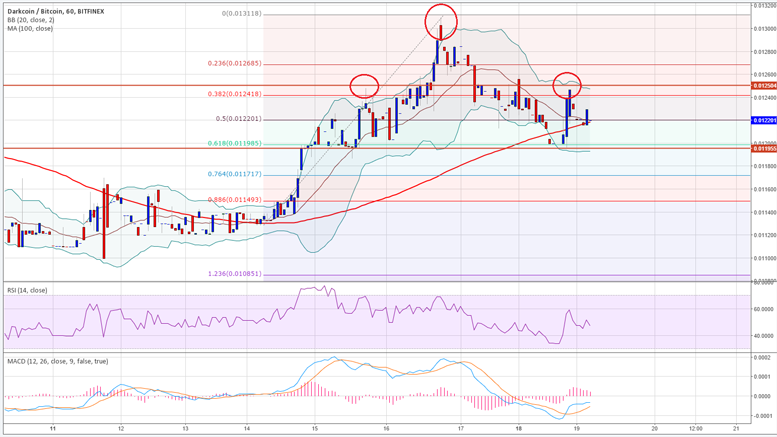
Key Highlights. Dash continues to struggle, as the shoulder resistance (highlighted in yesterday's analysis) at 0.0125BTC stalled upsides on many occasions. As long as the prices are below 0.0125BTC, Dash might head lower. Our highlighted head and shoulders pattern is still valid, and if bears gain control, we might witness a pullback in Dash. 0.0125BTC as a Hurdle. Dash settled above the 100 hourly simple moving average, which took the price towards 0.0125BTC. The mentioned level represents a shoulder resistance area of the head and shoulders pattern as highlighted in the chart attached.....

Bitcoin price has slumped more than 3.5% bringing the bearish Head and Shoulders pattern to near completion. Bitcoin dropped from roughly $254 to $243 which is in close proximity to the target of $241.50. With this loss, the cryptocurrency has erased all the gains for the month of April. Each Bitcoin is currently worth $244. An analysis of the 240-minute BTC/USD price chart reveals that the damage has been done and the price may consolidate or rebound in the coming sessions. Head & Shoulders Pattern - Bitcoin had been forming a Head & Shoulders pattern - a technical bearish reversal....
Key Highlights. Litecoin price is likely forming a head and shoulders pattern on the hourly chart (price feed from Bitfinex). If the highlighted pattern is valid, then the price may break lower and head towards the all-important $3.00 support area. There is a lot of bearish pressure, as our previously stated resistance at $3.20-30 continued to act as a barrier. Litecoin price may dive sharply moving ahead, as there is a bearish pattern (head and shoulders) forming on the hourly chart. Neckline Break Near? We mentioned in yesterday's post that Litecoin price may head lower as there was a....

Bitcoin Price Key Highlights. In the previous weekly analysis, we highlighted an inverse head and shoulders pattern, which played well and acted as a catalyst for an upside move. The price is currently trading in a positive zone, as it settled above the neckline of the inverse head and shoulders pattern. Bitcoin price after trading lower and finding support around 200.00 formed an inverse head and shoulders pattern for a move higher. Inverse Head and Shoulders Pattern. This past week we stated that the 200.00 support area was a major barrier for sellers that prevented more downsides and....

Key Highlights. Dash prices continue to consolidate in a choppy manner, but with a slight bullish sentiment. An ascending channel formed on the hourly chart, which if broken might open the doors for more gains in the short term. It looks like our long observed head and shoulders pattern is not valid, as the right should is taking too much time and waves. Channel as a Catalyst. We followed a Head and Shoulders pattern from the past two days on the hourly chart, but it looks like it is not shaping up nicely. There is a choppy price action underway, and the formation of the right shoulder of....