Litecoin Price Technical Analysis for 22/5/2015 - Monstrous Rally
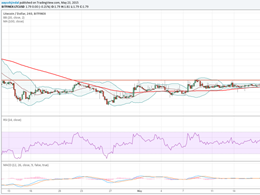
After having stopped for breath, bulls have steamrolled the bears and Litecoin surged 5.6% to hit the highest level in a week. With this rise, Litecoin has also broken away from a medium-term trading range and looks well poised to accumulate hefty gains going ahead. Owing to the strong advance, Litecoin has become expensive to $1.532. Technical analysis of the 240-minute LTC/USD price chart indicates that even after the massive surge, there is still steam left in Litecoin and it may eventually touch $1.600. Litecoin Chart Structure - Litecoin has staged a positive breakout after having....
Related News
In the past 24 hours, Litecoin has traded on a very calm note; barely retesting the previous low of $1.755 and edging up only slightly higher to touch $1.876. The virtual currency seems to be taking a “resting break” after the monstrous run-up to 2-month highs. Litecoin has skid 2.12% from yesterday's observation to trade at $1.801. Technical analysis of the 240-minute BTC/USD price chart indicates that the current market condition offer no high-profit, low-risk trading opportunities. Litecoin Chart Structure - In my previous analysis, I had discussed that Litecoin was off from its recent....
Key Highlights. As highlighted during the last week's analysis, Litecoin enjoyed a monstrous rally and currently consolidating gains. There is a chance of one more spike higher, but in that situation, it would be interesting to see how sellers react. Litecoin recent surge higher towards the $2.00 level was very impressive, but the price was just shy of the mentioned level and traded as high as $1.94. Currently, the price is consolidating and setting up for the next move. The Bollinger bands are shrinking and pointing that the price might move in a range after the mentioned monstrous rally.....
After registering a fresh 2015-top of $3.194, Litecoin can be seen consolidating below $3.000. However, with momentum and chart structure strongly supporting the buyers, Litecoin has edged up 3.33% to $2.945. Now that the key trigger for the financial markets world, i.e. the Fed meeting has been priced in, it would be interesting to see if Litecoin is able to continue its rally. Technical analysis of the 240-minute LTC-USD price chart suggests that the cryptocurrency is still a very risky trade and should be avoided for now. Litecoin Chart Structure - As can be seen from the chart above,....
Litecoin bears have been smoked by the massive 27% rally in the past 24 hours following a high volume breakout from the range I discussed in my previous analysis, New Range. The surreal rise in Litecoin price has also pushed it to the highest level of 2015. Litecoin is currently trading at $3.871, a strong advance from yesterday's $3.047. Litecoin's jump to a fresh 2015-high closely follows Bitcoin's leap to a new June high, as the Greece crisis comes to its D-day. A technical look at the 240-minute LTC-USD price chart above tells that Litecoin has entered the "no-buy" zone due to its....
Key Highlights. Litecoin enjoyed a monstrous rally as highlighted in the previous analysis. Prices surged higher and traded as high as $1.94 where sellers defended more upsides. Litecoin spiked sharply higher this past week to increase by more than 15%. There was a major range formed on the 4-hours chart before the price rushed higher. The $1.50 level was an important barrier for buyers, which was breached to open the doors for a rally as Litecoin steamed towards $1.90-$2.00. The bulls have completely outpaced the bears and managed to push prices within a span of a single day. Currently,....


