Dash Price Technical Analysis - No Sign of Sellers
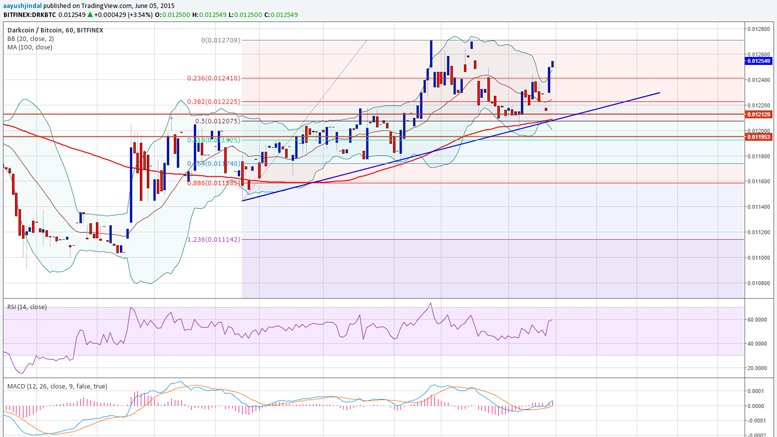
Key Highlights. Dash price failed to move lower and continued to trade higher. Our anticipated Double Top pattern resistance was broken, cancelling the view of a downside reaction. More gains are likely as long as the price stays above a crucial bullish trend line formed on the hourly chart. Dash price moved above 0.0127BTC, and continued to follow a nice bullish trend with sellers failing time and again to defend the upside. 0.0124BTC as a Buying Area. Dash price silently moved above a critical resistance of 0.0127BTC with the opening bell and cancelled the probability of a downside....
Related News
Dash Price Key Highlights. Dash price moved back lower once again and looks set for a retest of the last low of 0.0111BTC. There is a flag pattern formed on the hourly chart, which might cause a break in the near term. The price is below the 100 hourly moving average, signaling more losses ahead. Dash price after spiking higher found resistance around 0.0121BTC and traded lower one more time. Retest of lows? We highlighted in yesterday's post that the Dash price moved above the 100 hourly simple moving average, but the move was not convincing. As a result, there was a downside reaction....
Dash Price Key Highlights. Dash price failed to move lower, and found support around a critical trend line as highlighted in yesterday's analysis. The Double top pattern is still valid, as the price is below the resistance area. If there is a break above 0.0130BTC, then more gains are possible in the near term. Dash price acquiring bids around the bullish trend line is a positive sign for buyers looking ahead. Trend Line Proved Worth. Yesterday, we highlighted that there is a possibility of a double top pattern forming on the hourly chart which could result in a move lower. There was a....
Key Highlights. Dash price crashed Intraday and traded lower to test 0.0107BTC where buyers appeared. There was a new monthly low established as sellers were in control. Dash price remains at risk of more downsides, as an important support area was breached. Dash price sliding lower is a warning sign for buyers as the price action suggest more losses moving ahead. Sell Rallies? We followed an important support area of 0.0116BTC for many days, but finally sellers managed to take the price below the mentioned level. The downside reaction was swift after the break, as the price traded towards....
Key Highlights. Dash price rebounded sharply after sellers failed to clear 0.0109BTC on a couple of occasions. It settled above the 100 hourly simple moving average, which can be considered as a worrying sign for sellers. Dash buyers are facing an uphill task, as there is a monster resistance around 0.0120BTC. A solid reaction was noted around the recent lows in Dash at 0.0109BTC where buyers successfully defended the downside. 0.0120BTC as a Major Hurdle. The Dash price managed to pop higher after failing around 0.0109BTC. Buyers successfully pierced the 50% Fib retracement level of the....
Dash Price Technical Analysis - Key Highlights. Dash price managed to stay above 0.0116BTC, but remains at risk of more losses. There are a couple of bearish trend lines formed, which are protecting gains in Dash. As long as the price is below 0.0120BTC it might continue to move lower. Dash price corrected a bit higher after settling around 0.0116BTC, but the upside was limited due to the number of hurdles on the upside. Can sellers break 0.0116BTC? As we highlighted yesterday that the Dash price found support around an important area of 0.0116BTC. The mentioned support was protected....


