Bitcoin Price Technical Analysis for 16/6/2015 - Breakout Achieved, Next Target $245?
Bitcoin has crossed the crucial resistance mentioned in A Breakout Everybody's Waiting For!, rising roughly 1.54% to trade at $235.75. The price appreciation has also led to overbought valuation for Bitcoin which might face stiff resistance from the next supply region at around $238. So, should you be buying Bitcoin now or not? Let's find out in the technical analysis below! Technical analysis of the above presented 240-minute BTC/USD price chart indicates that bulls have complete control over the situation and that Bitcoin is a pure buy-on-dips play. Bitcoin Chart Structure - After....
Related News
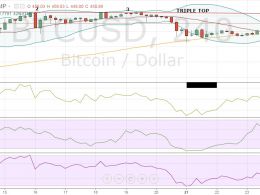
The Christmas isn’t turning out to be merry for Bitcoin. The cryptocurrency is struggling near the overhead resistance of $465. It is now trading 1.28% lower at $450.89, raising concerns that the market participants might pull out their funds in the holiday season. As a result, several technical indicators are also showing declines. We advised in the previous Bitcoin price technical analysis Target Achieved that traders should book at least partial profits in their long positions. And for today’s analysis, we will again be using the 4-h BTC-USD price chart from BITSTAMP.
Bitcoin continues to rise strongly and sharply post its crucial breakout. In my previous analysis titled Breakout Achieved, Next Target $245?, I did mention the possibility of the price touching $245 but did expect minor hindrance near $240. However, Bitcoin had other plans. The cryptocurrency not only thwarted all the bearish blows in its way but also exceeded the expectations by comfortably crossing the $250-mark. Since yesterday, Bitcoin has advanced more than 4.7% to trade at $246.85. Technically, even though bulls have a strong and steady grip on the situation, the upmove will not be....
Bitcoin has erased all the gains in the past 24 hours achieved since the breakout. The decline has brought the price down to the crucial support level of $240. Bitcoin's rally to $248 fell short of achieving its primary target of $250. In my previous analysis, Inches Towards Target!, I had stated of a possibility that Bitcoin may witness severe profit booking as the Greece crisis came to an end, and a crack of $240 might just confirm that. Bitcoin is trading down 1.59% at $243.05. Analysis of the 240-minute BTC-USD price chart confirms that bears are increasing the pressure but the final....
Bitcoin briefly topped $250 for the first time since August 19, 2015, hitting a fresh monthly high of $250.09. We concluded the previous Bitcoin price technical analysis Retreats From Monthly Highs on a positive note saying that market participants should not be concerned about the drop and instead go long in Bitcoin near $242 for a target of $250. As can be seen, Bitcoin hit an intraday low of $242.82 before meeting the said target. Bitcoin is currently trading at $248.81, up 1.92 percent. And yes, we stand by our long call! bitcoin price chart. Below are the latest technical....
Bitcoin has jumped more than 4% to $456.75 as bulls take advantage of the positive technical undertone. With this, the cyptocurrency has also met our prescribed target of $458. So, should you be booking profits now? Let us find that out with the help of technical analysis conducted on a 4-h BTC-USD price chart taken from BITSTAMP. Chart Structure – Bitcoin is now threatening to take out the Triple Top resistance near $465. The resurgent bulls look in complete control of the situation. Bollinger Bands – The cryptocurrency is sustaining above the upper range of the BB, after taking support....


