Bitcoin Price Technical Analysis for 20/7/2015 - A Shorting Opportunity?
Bitcoin is trading under pressure as the Greek banks are supposed to open to the public today. Down 0.63% since our previous observation, Bitcoin has broken the upward sloping trendline, thereby creating a low-risk, shorting opportunity. Bitcoin is now trading at $276.09. In my analysis Buy, With Caution! I expressed that I expected a swift decline in the price in case the trendline was breached. Even though the support has been pierced and the price remains relatively flat, technicals have undergone a severe deterioration. Take a look at the technical analysis of the daily BTC-USD chart....
Related News
Bitcoin has risen more than 1% since yesterday as short sellers book partial profits near the bulls' mansion. However, this advance is not a reversal but rather an opportunity to create fresh short positions in the cryptocurrency. Bitcoin is now valued at $225.46. Below has been presented the latest technical considerations derived from the 240-minute BTC-USD price chart. Bitcoin Chart Structure - After taking support from near $220-levels, Bitcoin rallied to $226.48 but struggled as the price approached May's low of $227. In technical analysis, a breached low acts as a new resistance.....
Bitcoin has presented before us an attractive trading opportunity to start the week. After breaking below a crucial technical support level, the digital currency has weakened considerably and may continue to depreciate in market value until it touches $230. Trading under pressure, Bitcoin is currently worth $234.97. Technically analyzing the 240-minute BTC/USD price chart reveals that the bulls will be under pressure in the immediate term and traders should consider going short in the counter on a rise. Bitcoin Chart Structure - As can be seen from the chart above, Bitcoin is currently....
Litecoin manages to stay afloat, thanks to the rebound in Bitcoin, and can be seen testing an important short-term resistance. At $2.844, Litecoin also offers a very low-risk shorting opportunity. But before we go all bearish on Litecoin, let us visit the latest technical indications for further clarity. Here is a lowdown of the key technical aspects from the daily LTC-USD price chart. Litecoin Chart Structure - From the above chart, it is clear that Litecoin has been trading in a contracting channel since September 7. The cryptocurrency is now at the higher end of this range, which tempts....
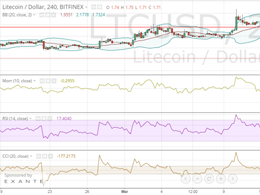
In yesterday's Litecoin analysis titled, Pressure Mounts, I discussed the possibility of the altcoin heading lower and recommended shorting. In the last 24 hours, bulls have been decimated as the value dived from $1.97 to a six-week low of $1.60. However, the price recovered to $1.71 as sellers booked partial profits. The crash in Litecoin price came in conjunction with an absolute slump in the Bitcoin price from $280 to $250. Bitcoin has routinely had a prominent effect on other cryptocurrencies. Technical analysis on the 240-minute LTC/USD indicates that the sentiment has turned strongly....
Bitcoin's disappointing action continues in the market as US dollar extends its rally against other leading currencies. Having failed at protecting $236, Bitcoin now trades under tremendous pressure, caving under which may lead to a further loss in value. Bitcoin has slid 0.33% to $235.19 since yesterday. Technically, the virtual currency looks weak and provides us with a shorting opportunity. For the analysis purpose, the 240-minute BTC/USD price chart has been considered. Bitcoin Chart Structure - The chart above clearly tells that post the support violation, bulls made an attempt to....


