Bitcoin Price Technical Analysis for 24/8/2015 - Pessimism Rules
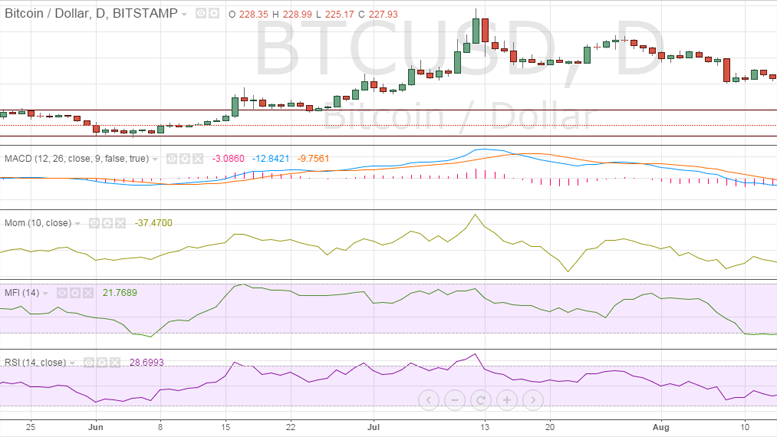
In the previous Bitcoin price technical analysis Rebounds, we discussed how the cryptocurrency was erasing the losses for the past week. But, the entire positivity was put to rest over the weekend as bears made a comeback and long positions were fast liquidated at the slightest hint of a pullback. Bitcoin, which is now trading at $227.93, has once again come closer to its important buying interest zone of $220-225. As the price decline has pushed the price closer to its crucial support, market participants may also be factoring in a breach of support this time, but I would recommend....
Related News
Since the last Litecoin price technical analysis Will This Support Hold?, Litecoin has gained $0.067 or 2.45 percent to trade at $2.800. The better part is that Litecoin is currently in a short-term technical pattern which will lead to a big swing in the price. Read on below the latest technical considerations of the daily LTC-USD price chart. Litecoin Chart Structure - Upon a closer look at the price action of the past 6-7 sessions, it can be found that Litecoin has been trading in a small triangle. A triangle, which is a continuation pattern, in a downtrend implies that a bigger downmove....
Darkcoin digs deeper into the red as the price slips from 0.0158BTC to 0.01473BTC in the past 24 hours. Previous lows were violated with the price plummeting to a new low of 0.0143BTC amid the selling pressure. Bulls are caving in to the pessimism and the cryptocurrency may see further downside in the absence of any positive trigger. Upon implementation of the technical analysis on the 240-minute DRK/BTC price chart, it can be concluded that the bearish momentum will only intensify from here on. However, the price decline may not be abrupt but could rather be steady. Chart Structure - Ever....
Darkcoin remains subdued as every rise is quickly undone by selling pressure. The cryptocurrency has failed at shrugging off the pessimism and continues to trade in a lower top fashion. Even with prices consolidating, it seems hard to advise that bears won't make a comeback and that buying should be initiated. Darkcoin users will now have to shell out 0.01588BTC. In the short term, Darkcoin may consolidate or fall to lower levels, but there doesn't seem to be a proper case to support any bullish argument. The 240-minute DRK/BTC price chart has been taken to implement the technical....
Litecoin falls 1 percent as Bitcoin extended its slide over the weekend. Now at $3.899, Litecoin is in a strong downtrend and price advances can be used to go short in the counter with tight stops in place. Technical analysis of the daily LTC-USD price chart conveys that pessimism still weighs on the cryptocurrency and good profits may be made on creating short positions at extremely low risks. But practicing the stop-losses is the key! Litecoin Chart Structure - The price chart conveys that Litecoin is trading in a lower top, lower bottom structure (marked in the chart), where repeated....
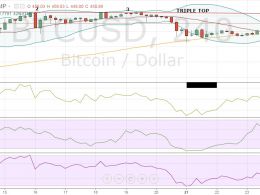
The Christmas isn’t turning out to be merry for Bitcoin. The cryptocurrency is struggling near the overhead resistance of $465. It is now trading 1.28% lower at $450.89, raising concerns that the market participants might pull out their funds in the holiday season. As a result, several technical indicators are also showing declines. We advised in the previous Bitcoin price technical analysis Target Achieved that traders should book at least partial profits in their long positions. And for today’s analysis, we will again be using the 4-h BTC-USD price chart from BITSTAMP.

