
Dash Price Technical Analysis - Retest of 0.0110BTC
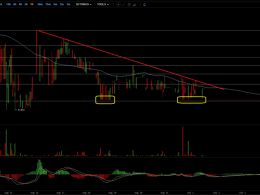
Dash Price Key Highlights. Dash price finally moved lower and retested the last swing low of 0.0110BTC. The price is still below the 100 hourly simple moving average, which is concerning and might ignite more losses. It would be interesting to see how the price trades in the near term and whether it gain bids around 0.0110BTC or not. Dash price continued to move lower and finally tested 0.0110BTC as anticipated in one of the previous posts. Downside Break? We stated many times that 0.0120BTC is a major resistance, and recently it played well. There was a downside reaction around from the....
Related News
Key Highlights. Dash price continued to surprise sellers as there was a major support area formed around 0.0110BTC. A bearish trend line is formed, which buyers need to clear if they have to take the price higher. A possible double bottom pattern is formed around 0.0110BTC, which might encourage buyers. Dash price found support near 0.0110BTC, but buyers need to gain pace if they have to take the price higher. What's next? There was no real action this past week in the Dash price, but there was a positive sign for bulls as a major support area was formed around0.0110BTC. Sellers made....

Dash Price Key Highlights. Dash price continued to trade in a range as there was no break below 0.0110BTC. As highlighted this past week there is a bearish trend line formed on the hourly chart, which continued to act as a barrier. The price is struggling to settle above the 100 hourly simple moving average, which is a negative call for buyers. Dash price found support around 0.0110BTC one more time, which caused an upside reaction this past week. Trend Line Break. The Dash price struggled to clear the range formed, and traded between 0.0110BTC and 0.0120BTC. There was a lot of bearish....
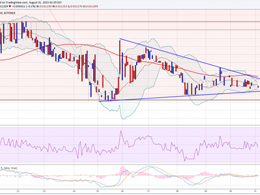
Dash Price Key Highlights. Dash price struggled to trade higher and continued to trade in a range with a major support at 0.0110BTC. There is a contracting triangle pattern formed on the hourly chart, which might act as a catalyst for the next move. One bearish sign is that the price is struggling to clear the 100 hourly simple moving average. Dash price trading in a range, but looks poised for a short-term break as there is a triangle pattern forming on the hourly chart. Break Ahead? The Dash price continued to weaken and failed on many occasions to trade below 0.0110BTC. The most....
Key Highlights. Dash price traded near our highlighted triangle pattern, and managed to stay above 0.0110BTC. The triangle upper trend was cleared, but the break is not convincing as there was almost no follow through. The price is still below the 100 hourly simple moving average, which is a worrying sign for buyers. Dash price failed once again to gain pace, but there are a few signs emerging that suggests more gains in the short term. 0.0113BTC as a Resistance. The Dash price managed to stay above an important support area of 0.0110BTC. There was a contracting triangle pattern, which we....

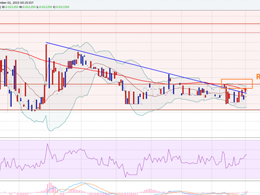
Key Highlights. Dash recovered sharply after diving towards 0.0110BTC where buyers managed to protect further losses. There is a bearish trend line forming on the hourly chart of Dash, which may perhaps act as a hurdle for buyers. Dash is struggling around an important level at 0.0120BTC, which was a support earlier and now acting as a resistance for more gains. Can Buyers Clear 0.0120BTC? This past week we forecasted a downside reaction in Dash once the price went below 0.0120BTC. There was a sharp downside, which took it towards 0.0110BTC where somehow buyers managed to hold the....