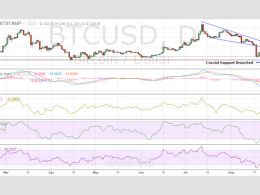
Bitcoin Price Technical Analysis for 25/8/2015 - Black Monday
To all those who track financial markets and asset classes, yesterday was a clear Black Monday. The global equity markets and commodities crashed as fears over the slowing Chinese economy once again gained prominence. Bitcoin too had its forgettable session yesterday as it cracked more than 13 percent intraday to hit a sub-$200 low. What's even more concerning is that the crucial support of $220-225 has been breached decisively, which has opened up the downsides to the target of $170-190. Technically, the violation of this support is a great indication that bears will exert even more....
Related News
After Bitcoin dived into deeply oversold territory following its collapse on Black Monday, massive unwinding of short positions has taken place thereby lifting the price substantially. Bitcoin is trading at $224.05, up more than 8 percent. In the previous Bitcoin price analysis Black Monday, it was said that a relief rally would occur sooner which should be used to create short positions. Therefore, if the Bitcoin price nears its previous top of $235, create bearish bets by placing a stop-loss above it. Take a look at the latest technical considerations below. Bitcoin Chart Structure - As....
Today marks the 33rd anniversary of the Black Monday on Wall Street that sent stocks setting historic records for intraday declines. Although this year already had a similar day of its own, there’s reason to believe that another collapse could happen in Bitcoin. Here are the primary factors behind what could cause the crypto market to drop on the ominous anniversary. Will Bitcoin Bow To Black Monday Anniversary? Black Thursday is a day that crypto […]
Yes, you read that right! The next price target for Litecoin is $2.000; my previous PT (price target) of $3.000 for August has been met and surpassed, and I believe the cryptocurrency will witness severe pain in the coming sessions as well. As Bitcoin witnessed its Black Monday, it became increasingly clear that Litecoin will face the wrath of the bears. Litecoin is currently trading at $2.530, down a massive 24 percent and the decline may only accelerate going forward. Take a look at the latest daily LTC-USD technical considerations below. Litecoin Chart Structure - Litecoin has broken....
Darkcoin price dropped yesterday to print a low of around 0.01180 BTC yesterday, yet it resumed rising again after touching the 62% Fibonacci retracement level we plotted during earlier analysis to rise again above the new uptrend lines we detected on Monday's analysis. DRK price reached a high of around 0.01335 BTC at the time of writing of this article. By studying the 1 hour Cryptsy (DRK/BTC) chart from bitcoinwisdom.com and plotting the 10 hour EMA (green curve) and the 20 hour EMA (orange curve) (look at the below chart), we can conclude the following: Darkcoin price dropped yesterday....
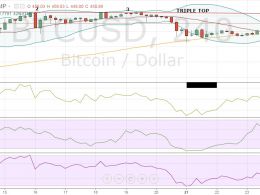
The Christmas isn’t turning out to be merry for Bitcoin. The cryptocurrency is struggling near the overhead resistance of $465. It is now trading 1.28% lower at $450.89, raising concerns that the market participants might pull out their funds in the holiday season. As a result, several technical indicators are also showing declines. We advised in the previous Bitcoin price technical analysis Target Achieved that traders should book at least partial profits in their long positions. And for today’s analysis, we will again be using the 4-h BTC-USD price chart from BITSTAMP.


