Dogecoin Price Weekly Analysis - Can Buyers Break 100 MA
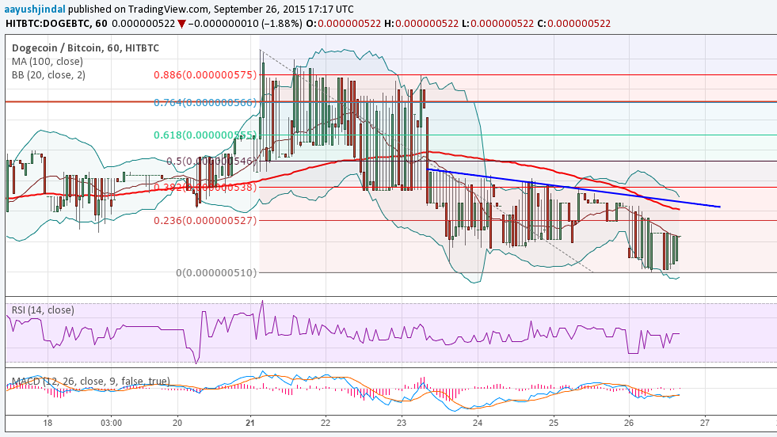
Dogecoin Price Key Highlights. Dogecoin price created a minor new low of 51.0 Satoshis, and managed to correct higher in the short term. As mentioned in the previous week's analysis, there is a significant resistance around the 100 hourly simple moving average. A break above it might ignite an upside reaction, taking the price higher moving ahead. Dogecoin price might trade higher if buyers manage to clear the 100 hourly MA and a bearish trend line. Break Feasible? There was a continuous rejection around the last swing low of 51.0 Satoshis, where sellers struggled to clear the mentioned....
Related News

Key Highlights. Dogecoin buyers trying their best to clear an important resistance area at 71.8 Satoshis. A broad range of 65.0-72.0 Satoshis as highlighted in the previous analysis continued to contain buyers and sellers. A break is must if we need to see some action in the short term. If you are considering to trade Dogecoin, then better wait for a convincing break above 72.0 Satoshis to enter a buy trade. Can it break higher? There was a large bearish candle formed on the hourly chart of Dogecoin recently, as highlighted in the weekly analysis. However, sellers failed to capitalize on....
Dogecoin Price Key Highlights. We highlighted this past week a contracting triangle pattern on the hourly chart, which acted as a pivot and caused a break. There was a downside break as anticipated which took the price towards another important support area of 56.5 Satoshis. The price is below the 100 hourly simple moving average (SMA), which is a worrying sign for buyers. Dogecoin price breached an important breakout pattern this past week, and showing more bearish signs on the hourly chart. Triangle Break. In one of the recent analysis, we highlighted a contracting triangle pattern on....
Dogecoin Price Key Highlights. Dogecoin price stayed in a range, but it looks like the price might head lower in the near term. Sellers are making an attempt to break the range low, if it is cleared more losses are likely. 0 Satoshis is a major support area, which must hold if buyers have to prevent the downside. Dogecoin price is at risk of a break lower, as buyers seem to be struggling to prevent the downside. Downside Break. The Dogecoin price stayed in a range throughout this past week, which prevented moves in one particular direction. However, it looks like sellers might be able to....
Key Highlights. Dogecoin continued to move lower as can be seen clearly on the daily chart. 5 satoshis is a major hurdle for Dogecoin where buyers might continue to struggle in the near term. The Daily Dogecoin/Bitcoin price chart suggests that sellers are in control, as Dogecoin moved lower to test 30 satoshis. It managed to find support and traded back higher, but found resistance around an important bearish trend line. There is a major cluster of hurdles formed at 39.5-40.8 satoshis, which is coinciding with the highlighted trend line. The Dogecoin price is also below the middle band of....
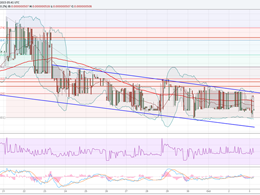
Dogecoin Price Key Highlights. Dogecoin price continued to trade in a tiny range and inside two trend lines on the hourly chart. The upper trend line on the hourly chart is acting as a monster barrier for buyers for more gains. However, as long as the price is above the 50 Satoshis, there are chances of more upsides moving ahead. Dogecoin price continued trade inside a range, and it looks like it is setting for a break in the near term. Break ahead? The Dogecoin price is forming an interesting pattern, which is setting up for a break in the short term. As highlighted in the previous week's....