Bitcoin Price Technical Analysis for 2/10/2015 - Uptrend Holds
Bitcoin is respecting the higher top, higher bottom structure and looks set to meet its target of $245. Currently trading up 0.75 percent at $238.66, Bitcoin is attracting the buyers on dips which solidify the uptrend. As Bitcoin remained majorly quiet during the week, this weekend may bring a good price action. From a technical perspective, some things have improved while some have taken a hit. Read on about them below. Bitcoin Chart Structure - Bitcoin is once again aiming for its target as the fears of a trend breakdown have been alleviated. The 12-day SMA of $234.1150 is expected to....
Related News
Trading with a slightly negative bias, Bitcoin has slipped to $244.28, down 0.94 percent yesterday. Even though the uptrend is intact, Bitcoin has failed to sustain above a key technical level which has led to severe deteriorations in the technical indicators. Let us discuss each of the factors in the technical analysis of the daily BTC-USD price chart below. Bitcoin Chart Structure - As has been marked in the chart above, the upward channel in which Bitcoin has been trading since the last week of September clearly holds. However, as discussed earlier, Bitcoin has failed to sustain above....
Litecoin falls 1.47 percent to $3.075 after kissing the resistance at $3.130. In the previous Litecoin price technical analysis, we said that Litecoin could leapfrog to higher levels on consistent support from the buyers, but what we have got instead is a bout of profit booking which once pulled down the price to an intraday low of $3.050. But can this decline prove fatal to Litecoin? Will the crucial support of $3.000 be breached? Let us try to find that out by conducting a technical analysis on the daily LTC-USD price chart. Litecoin Chart Structure - As can be seen, the higher top,....
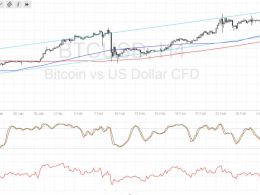
Bitcoin price is in the middle of a pullback from its longer-term climb but might be ready to resume the uptrend if support holds. Bitcoin Price Key Highlights. Bitcoin price has been selling off in the past couple of days after breaking below a short-term rising trend line. The longer-term uptrend is still intact and bitcoin price is on its way to test a major support area. Technical indicators are suggesting that the uptrend could resume after this correction. Technical Indicators Signals. The 100 SMA is above the longer-term 200 SMA so the path of least resistance is still to the....
Ethereum Price Key Highlights. Ethereum price has been on a downtrend on its longer-term time frames, but it looks like the tides could turn. A double bottom pattern is visible on the 4-hour chart and price is making its way up to test the neckline at 0.0040. Ethereum price could be in for a long-term uptrend if it is able to break past the neckline resistance soon. Technical Indicators In Favor Of the Bulls. The technical indicators on the 4-hour time frame support further gains in ethereum price, as the 100 SMA just crossed above the 200 SMA. This signals that the path of least....
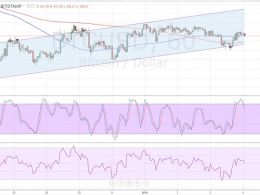
Bitcoin price has been slowly trending higher since the last week of December 2015 and might be poised for more gains. Price is currently moving inside a short-term ascending channel visible on the 1-hour time frame. Bitcoin price could carry on with its uptrend, although technical indicators are giving mixed signals. Bounce or Break? First, the bullish signals. Bitcoin price has just bounced off the ascending channel support around $425, hinting that the uptrend is likely to carry on. In addition, the 100 SMA is above the longer-term 200 SMA, which means that the path of least resistance....


