
Bitcoin Price Technical Analysis for 13/10/2015 - Retreats From Monthly Highs
Bitcoin has retreated from its monthly highs as market participants rush to book profits in their long positions amid fears that the cryptocurrency may have been overbought. Bitcoin is currently trading at $244.12, down 1.38 percent and closer to the crucial upward sloping support line. Just yesterday, we discussed how Bitcoin started the week on a strong note, and flash forward 24 hours, the bulls have frittered away the advantage. The uptrend is still intact, but the momentum and strength readings have clearly been hit. Bitcoin Chart Structure - As Bitcoin struggles to limit its losses,....
Related News

Bitcoin briefly topped $250 for the first time since August 19, 2015, hitting a fresh monthly high of $250.09. We concluded the previous Bitcoin price technical analysis Retreats From Monthly Highs on a positive note saying that market participants should not be concerned about the drop and instead go long in Bitcoin near $242 for a target of $250. As can be seen, Bitcoin hit an intraday low of $242.82 before meeting the said target. Bitcoin is currently trading at $248.81, up 1.92 percent. And yes, we stand by our long call! bitcoin price chart. Below are the latest technical....
Bitcoin price is continuing to make higher highs which confirm the bullish momentum of the market throughout the past few days. We have been adding up the bullish signals via our daily analysis articles this week. Bitcoin Price Technical Analysis. By observing the 1 day Bitfinex BTC/USD charts from tradingview.com (look at the below chart), we can see that bitcoin price closed at increasing highs on 2 successive days. At the time of the writing of this article, the price exceeded $233 and is expected to increase even more to surpass yesterday's closing price. By plotting the MACD on the....

I will resume writing a daily LTC price technical analysis starting from today, so throughout this article, I will try establishing some key resistance and support points that would help us read through the charts and detect clues that can predict future price movements. Last week, LTC price surged to exceed $4 on the 31st of October. The bullish wave started a day earlier than Bitcoin's surge and Litecoin's price rose from $3 to around $3.72 last Sunday. However, as Bitcoin's price rose above the $340 resistance level, LTC also continues to print higher highs. Bulls in Control On 1 Day....

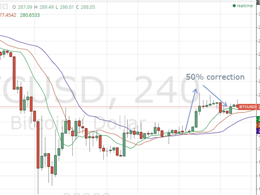
Bitcoin has extended its rally, hitting a new high for June as the month comes to a close. Also, the fate of Greece will be sealed today. Bitcoin has hit a new monthly high of $258.89 and is currently trading up 3.36% at $258.55. With this, Bitcoin is up for the second consecutive day. Technical analysis of the 240-minute BTC-USD price chart confirms that speculation has pulled the cryptocurrency into the overbought region, but that is not to say that the price cannot rise higher. Bitcoin Chart Structure - As can be seen from the chart above, Bitcoin is retesting the previous peaks before....

Bitcoin has started this week on a very strong note as it raced higher to $247.53, on course to its highest closing in over a month. In the previous Bitcoin price technical analysis Mixed Technicals, we discussed how a couple of technical indicators were showing divergences from the other two. Well, currently, all of them are displaying much stronger readings. Bitcoin is trading at $247.53, after hitting a monthly high of $248.50. Even though Bitcoin is in a strong uptrend, let us review the latest technical indications to look for factors that may hamper the bullish mood. Bitcoin Chart....