Dogecoin Price Weekly Analysis - Important Trend Line Support
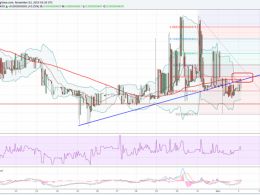
Dogecoin Price Key Highlights. Dogecoin price spiked higher twice but both times it found resistance near 49.0 Satoshis. There is a critical bullish trend line formed on the hourly chart, which is acting as a support area for the price. The price is currently above the 100 hourly simple moving average, which is a good sign for bulls. Dogecoin price managed to gain traction and spiked higher, but sellers managed to defend successfully the key levels. Can Sellers make it? The Dogecoin price showed some signs of relief, as it climbed higher to trade above the 40.0 Satoshis resistance area.....
Related News
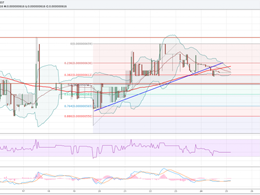
Dogecoin Price Key Highlights. Dogecoin price moved lower and broken an important support area around 42.0 Satoshis. A bullish trend line and support area was breached to open the doors for more losses. 0 Satoshis might now act as a resistance, as the 100 hourly simple moving average is also positioned around the stated level. Dogecoin price is under the bearish pressure as sellers managed to take the price below a critical support area. Importance of 100 MA. As highlighted in the weekly analysis there were some signs of relief for the Dogecoin price, but that did not last forever. There....
Dogecoin Price Key Highlights. Dogecoin price continued to trade above an important support area of 52.5 Satoshis, which is a swing area. There is a bearish trend line formed on the hourly chart, which is acting as a minor resistance for buyers. Dogecoin price might move higher in the near term, as buyers successfully defended 52.5 Satoshis many times. 52.5 As a Support. The Dogecoin price continued to find bids around a major support area of 52.5 Satoshis. Sellers made several attempts recently to clear the stated level, but every time buyers managed to defend the downside. There is also....
Dogecoin Price Key Highlights. Dogecoin price failed to hold gains, and moved below an important support area to call for more losses. The support trend line on the hourly chart as highlighted yesterday was breached to encourage sellers. The price has also moved below the 100 hourly simple moving average, which is a warning sign in the near term. Dogecoin price after failing to move above 66.0 Satoshis moved lower and broke an important support trend line. Trend line break. We followed a support trend line on the hourly chart, which was acting as a hurdle for sellers. However, they managed....
Key Highlights. Dogecoin continued to move lower as can be seen clearly on the daily chart. 5 satoshis is a major hurdle for Dogecoin where buyers might continue to struggle in the near term. The Daily Dogecoin/Bitcoin price chart suggests that sellers are in control, as Dogecoin moved lower to test 30 satoshis. It managed to find support and traded back higher, but found resistance around an important bearish trend line. There is a major cluster of hurdles formed at 39.5-40.8 satoshis, which is coinciding with the highlighted trend line. The Dogecoin price is also below the middle band of....

Key Highlights. Dogecoin price failed once again to break a major resistance area near 0-32.0 Satoshis and traded lower. There is an important trend line and support area forming near 29.0 Satoshis on the 30-min chart (data feed from HitBTC). A break below the same may call for a move towards the last weekly low of 27.5. Dogecoin price continued to trade in a range, and there are no real signs of a break. We need to keep an eye on the 4-hours chart triangle pattern for the next move. Retest of lows? Dogecoin price recently spiked above 31.0 Satoshis resistance area, but failed to settle....