
Bitcoin Price Technical Analysis for 18/11/2015 - Bearish Pennants Galore!
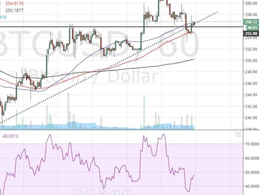
Bitcoin Price Key Highlights. Just a few weeks after breaking below a bearish pennant on its 4-hour time frame, bitcoin price has formed yet another continuation pattern. Bitcoin price is still stuck inside the triangle or flag formation, with the path of least resistance to the downside since a downtrend is ongoing. Bitcoin price could be due for another break lower, potentially sending it down towards support at the $300 level. Mixed Technical Signals. Technical indicators are giving mixed signals though, which means that a downside break isn't guaranteed yet. For one, the 100 SMA is....
Related News

Bitcoin has been consolidating since hitting a low around 166. Price has rebounded above 300 briefly, and then retreated. Still, BTCUSD has been hanging onto the consolidation mode in what appears to be a triangle. With price action already so close to the triangle apex, a breakout is imminent, but it will not be of much significance by itself. Let's see what other technical clues we will need. Bitcoin (BTCUSD) 24/2/2015 Daily Chart. The daily chart shows that since price tagged 300, bearish candles have dominated. In fact, last Friday's bearish candle combined with the previous 4 daily....
Not much happened today in the price action of litecoin. As we can see in the 1H chart, price has been drifting sideways since the cryptocurrency rallied from around 1.60 to about 1.82. While price is indeed still in this consolidation range, we can see a bearish bias. Litecoin (LTCUSD) 1H Chart April 1, 2015. 1) The 200-, 100-, and 50-hour simple moving averages (SMAs) are in bearish alignment and are sloping down. 2) Price is starting to hold below the cluster of these SMAs, which shows bearish bias. 3) The RSI has held below 60, and has tagged 30, showing development of bearish....

Ethereum has dropped 1.5 percent to 0.00197BTC, in line with our bearish expectations. We iterated our short view in the previous technical analysis titled Bitcoin-fueled bounce fades away. The price action in the past 24 hours has been strongly bearish and threatens a further 4% drop in the pair. Chart Structure – The underlying weakness in ETH-XBT forced the pair below the 20 4-h SMA (we discussed this possibility in the previous price analysis). The bulls did attempt to reverse the losses but failed miserably as the bears used the breached moving average as an offloading level. The pair....

The weekend brought pain for Bitcoin, but that was always on the cards. My Friday's Bitcoin price technical analysis Palpable Strain concluded on a bearish note saying that a close below $286 could bring in further decline, and as can be seen, the cryptocurrency did slump intraday to $276.57 before taking support from near the previous consolidation level of $275. Bitcoin is currently trading at $281.26. Now, the important question that must concern the trading community is: Is this relief from the support level for real or is it a trap? This analysis will aim to provide some answers.....
When we entered the April 6th session, we saw bitcoin in multiple bullish breakouts since the end of last week. We also saw that despite these bullish signs in the 1H chart, the technical picture in the 4H chart was still bearish and offered a falling trendline to challenge the bullish attempts. Let's follow up on the technical developments in both time-frames. Bitcoin (BTCUSD) 1H Chart April 7. As we begin the April 7 session, we can see that bitcoin failed to extend above 262. Here are some observations, bullish vs. bearish: Bullish:1) Price is still holding above the 200-, 100-, and....