
Bitcoin Price Intraday Analysis for 19/11/2015 - Downside Breakout Taking Place
Bitcoin Price Key Highlights. After spending weeks sitting pretty inside a tight consolidation pattern, bitcoin price is finally getting back on its feet and showing some momentum. A downside breakout from the ascending triangle pattern and short-term pennant formation appears to be taking place. Bitcoin price could be in for more downside now that a long red candle has closed below the ascending triangle support at $330. How Low Can It Go? Bitcoin price could have its sights set on the bottom of the triangle pattern near the $300 major psychological level as its target for the selloff.....
Related News

Ethereum Price Key highlights: Ethereum price is starting to make a downside break from the previous triangle consolidation pattern highlighted. This suggests that selling momentum is starting to pick up once more, potentially yielding further declines. Ethereum price has moved below the previous intraday support at 0.00250BTC, setting the stage for a potential drop to the next support at 0.00230BTC. New record lows? Increased selling momentum could take the price down to its record lows at around 0.00210BTC in mid-August this year or even lead to the creation of new lows. The 100 SMA is....

Earlier this morning we published a piece that highlighted the action we have seen in the bitcoin price over the past couple of days. We noted the run towards 300 we saw on Tuesday afternoon, the subsequent correction towards 287 flat, and the triangle that formed and contained price action throughout Wednesday morning in Europe. Now the European session is drawing to a close, we have seen the pattern that we highlighted complete, and the bitcoin price once again resume its bullish momentum. With this said, what are the levels to keep an eye on as we head into the early US afternoon....
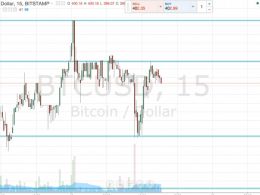
Here's what to keep an eye on in the bitcoin price this evening. Stops, entries and key levels. In this morning’s bitcoin price watch piece, we noted that we had seen the 400 flat level breached for the first time in a few weeks, and that as a result, our overarching bias took a bullish turn. We set up our breakout and intrarange strategies to gain from any intraday volatility during the European morning and early afternoon sessions, and defined our risk. Action has now matured, and we got a break of support to the downside shortly after our analysis was published. Unfortunately, the....

Dogecoin Price Key Highlights. Dogecoin price fell and traded close to our first sell target of 76.0 Satoshis as anticipated in yesterday's analysis. There was a buying interest noted around 71.0 Satoshis where sellers stepped back. The bearish pressure remains intact, as there are many hurdles formed on the upside for buyers. Our forecast of a move lower was right, as there was a downside reaction Intraday taking the price towards 71.0 Satoshis. What's next? Yesterday, the price broke a critical support area of 76.0 Satoshis, which was one of the main reasons we thought that the price....

An intraday look at the bitcoin price, what we've seen so far, and what we expect to see moving forward. Yesterday's action in the BTCUSD saw the bitcoin price decline just shy of $40, from intraday highs around 268.00 to lows mid evening just ahead of 228.00 flat. Our longer-term analysis of the pair (published a little earlier today) suggested that we may see a correction of this decline during today's session, and a look at the intraday chart vindicates this suggestion. The chart shows channel support "hit and hold" on three or four occasions throughout the European morning/afternoon,....