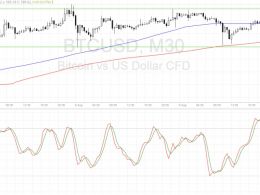
Bitcoin Price Technical Analysis for 23/11/2015 - Stuck in a Range!
Bitcoin Price Key Highlights. Bitcoin price appears to be moving sideways these days, barely able to establish a clear strong direction after its sudden rally and subsequent drop earlier in the month. Price is bouncing back and forth between support at $315 and resistance at $340, and might stay inside this range for quite some time. Technical indicators are suggesting that bitcoin price could keep moving inside its short-term range, although the path of least resistance is still to the downside. Mid-Range Area of Interest. At the moment, bitcoin price is stalling at the middle of its....
Related News
Bitcoin price is settling inside a range but technical indicators seem to be hinting at an upside breakout. Bitcoin Price Key Highlights. Bitcoin price has been moving sideways on the slowdown in volatility, stuck in a range between support at $575 and resistance at $590. Price appears to be bouncing off the top of the range once more, gearing up for another test of support. However, technical indicators are suggesting that a breakout could take place. Technical Indicators Signals. The 100 SMA is still above the longer-term 200 SMA on this time frame, signaling that the path of least....

Litecoin continues to consolidate. In the 1H chart below we see a sideways range roughly between 1.80-1.90. Litecoin (LTCUSD) 1H Chart 25/2/2015. Here are some observations:1) The 200-, 100-, and 50-hour simple moving averages (SMAs) are clustered together. This reflects a market that not only has no direction, but has very low volatility. 2) Price has been whipping over and under the cluster of SMAs. This also reflects indecision, but we can already see that by looking at the sideways price action. 3) The RSI has tagged 30, but has been holding below 60 for the most part. This actually....

Litecoin bears have been smoked by the massive 27% rally in the past 24 hours following a high volume breakout from the range I discussed in my previous analysis, New Range. The surreal rise in Litecoin price has also pushed it to the highest level of 2015. Litecoin is currently trading at $3.871, a strong advance from yesterday's $3.047. Litecoin's jump to a fresh 2015-high closely follows Bitcoin's leap to a new June high, as the Greece crisis comes to its D-day. A technical look at the 240-minute LTC-USD price chart above tells that Litecoin has entered the "no-buy" zone due to its....

Ethereum Price Key Highlights. Ethereum price is still stuck inside its range, finding support at 0.00285 and resistance at 0.00305. Price bounced off the bottom of the range as expected and is on its way to test the top again. Ethereum price could keep moving sideways, especially if the top of the range holds as resistance and spurs another test of support. Buyers Regaining Control. Technical indicators are suggesting that a bounce is underway, with stochastic and RSI both climbing out of the oversold region to indicate a return in bullish momentum. The average directional index is moving....

In the previous Litecoin price technical analysis Flat Action, we discussed that if Litecoin fails to cross the resistance posed by the level of $3.160, it runs the risk of entering into a range. As can be seen, Litecoin has plummeted 4.44 percent to $2.907 as traders resorted to profit taking near the resistance. Another factor weighing on Litecoin is the weakness in the Bitcoin market. However, the good news is that Bitcoin is now close to its support level of $235. Values from the technical indicators overlaid on the daily LTC-USD price chart also suggest that there is an increased....