Dogecoin Price Technical Analysis For 15/12/2015 - Risk of Further Declines
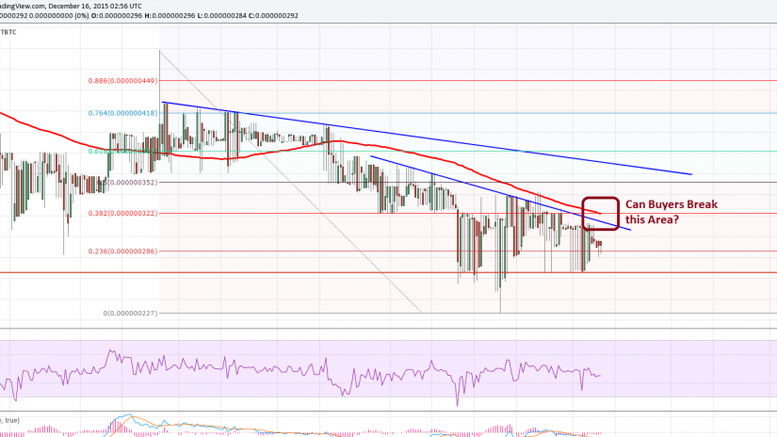
Key Highlights. Dogecoin price failed time and again to trade higher and currently following a downward sloping path. There is monster trend line resistance area formed on the 4-hours chart (data feed from HitBTC), acting as a hurdle for an upside move. A short-term resistance area is now around 31.0 Satoshis. A break above it may ignite a recovery. Dogecoin price remains at a risk of further declines, as there is hardly any bullish sign for buyers to take it higher in the short term. Can Buyers Break Trend Line Resistance Area? As mentioned, there is a crucial trend line resistance area....
Related News
Dogecoin seems to have formed a trading range which has the put the risk/reward ratio highly in favor of traders. As expected, the price has not violated the support level of 43 satoshis and has rebounded strongly, approving it as a near-term floor. In another shot at taking out the resistance of 50 satoshis, Dogecoin has failed miserably. In my previous analysis, it was discussed that volatility may continue to play a decisive role, and the price is indeed oscillating wildly in the range. As of this moment, each Dogecoin is worth 47.9 satoshis. After analyzing the 240-minute....
The Christmas isn’t turning out to be merry for Bitcoin. The cryptocurrency is struggling near the overhead resistance of $465. It is now trading 1.28% lower at $450.89, raising concerns that the market participants might pull out their funds in the holiday season. As a result, several technical indicators are also showing declines. We advised in the previous Bitcoin price technical analysis Target Achieved that traders should book at least partial profits in their long positions. And for today’s analysis, we will again be using the 4-h BTC-USD price chart from BITSTAMP.
Dogecoin Price Key Highlights. Dogecoin price did indicate further downside momentum, as predicted in an earlier technical analysis write-up on the consolidation pattern repeating itself. With the downside break, more sellers could hop in the ongoing downtrend and push dogecoin price to new lows. Dogecoin price confirmed the buildup in bearish pressure with a strong downside break below the consolidation pattern on its 1-hour chart. Where To Next? Price has broken below the previous lows in October 21, hinting that bears are unstoppable at this point. Stochastic and RSI are both on the....
Key Highlights. Dogecoin price declined and traded below an important support area of 76.0 Satoshis as anticipated in yesterday's analysis. It looks like the price is heading towards the next level of support at 71.0. 100 hourly MA still remains a concern for buyers, as they failed to break it on many occasions. We were right when we noticed a break in Dogecoin price chart, as there was a downside thrust Intraday. What's next? We highlighted the possibility of a down-move in Dogecoin price yesterday, which continued as the price moved below a critical support of 76.0 Satoshis. There was a....
Dogecoin Price Key Highlights. Dogecoin price traded higher recently, but the upside move was not convincing, which leaves it at a risk of declines. The broken trend line (as highlighted in yesterday's post) was tested again. There is a chance that the price might head lower one more time and retest 60.0 Satoshis in the near term. Dogecoin price failing to hold gains is a worrying sign, and might call for a move lower if buyers did not manage to push it higher. Retest of 60 Satoshis? The Dogecoin price showed a lot of bearish signs on the hourly chart, which leaves it at a risk of a move....


