Bitcoin Price Technical Analysis for 17/12/2015 - Reversal Signal Forming?
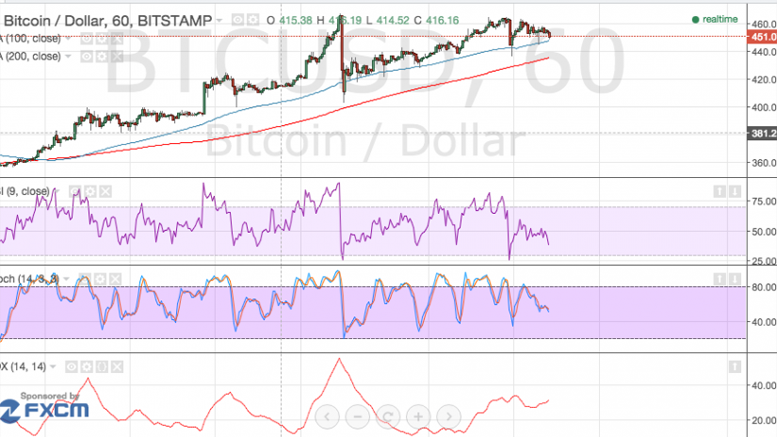
Bitcoin Price Key Highlights. Bitcoin's price appears to be having trouble sustaining its climb, as it is testing the ceiling at the latest highs. If this area continues to hold as resistance, the Bitcoin price could complete a double top pattern with a neckline at $400. Bitcoin's price is undergoing weaker bullish momentum, with a return in selling pressure likely to spur a continued selloff. Potential Downtrend. A break below the possible double top neckline could set off a longer-term downtrend for the Bitcoin price, likely taking it down to the next area of interest around $300-350.....
Related News
Bitcoin price might be in for a larger drop based on the short-term reversal formation but technical indicators are giving a different signal. Bitcoin Price Key Highlights. Bitcoin price seems to be having trouble sustaining its climb, as it started forming lower highs so far this week. A head and shoulders pattern seems to be forming, indicating a potential reversal if price breaks below the neckline around $570. If that happens, bitcoin price could drop to the next visible support around $540. Technical Indicators Signals. The 100 SMA is above the 200 SMA so the path of least resistance....

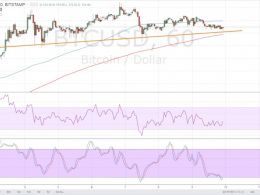
Bitcoin Price Key Highlights. Bitcoin price has gradually been trending higher but it looks like the rally is starting to lose steam. Price might be forming a head and shoulders pattern on its 1-hour time frame, as the recent bounce off the Fib levels barely gained traction. Bitcoin price could be due for another selloff if the reversal formation is completed and a downside break of the neckline is seen. Short-Term Area of Interest. Using the Fib tool on the latest down move shows that the 50% level lines up with an area of interest around $365. This also coincides with the 100 SMA, which....

An analyst has pointed out how Chainlink is forming a TD Sequential sell signal right now, which could lead to a retracement to this level. Chainlink Could Decline To $12.50 Following The Sell Signal As explained by analyst Ali in a new post on X, LINK could be heading toward a correction based on what the TD Sequential signal says. The “Tom Demark (TD) Sequential” is a popular indicator in technical analysis that is used to pinpoint reversals in the price of any asset (which, in the current discussion, is naturally Chainlink). The metric gives a signal whenever the asset has....

Yesterday's 4-hour chart reversal signal had seen price turn down, but only briefly. The declining wave did not make a new local low and reverse divergence has forced price to the upside again. Technical analysis finds this advancing wave has little hope of making headway. This analysis is provided by xbt.social with a 3 hour delay. Read the full analysis here. Not a member? Join now and receive a $29 discount using the code CCN29. Bitcoin Price Analysis. Time of analysis: 17h09 UTC. BTC-China 1-Hour Chart. From the analysis pages of xbt.social, earlier today: Here in the 1-hour chart,....
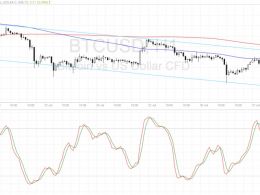
Bitcoin price is hovering at the resistance of the short-term descending channel and could be in for a continuation or reversal. Bitcoin Price Key Highlights. Bitcoin price seems to be establishing a downtrend now that it’s forming a descending channel on its 1-hour time frame. Price is now testing the channel resistance, still deciding whether to make a bounce or a break. Technical indicators seem to be indicating that the selloff could resume but there are also potential arguments for a reversal. Technical Indicators Signals. The 100 SMA is below the longer-term 200 SMA so the path of....