RubyCoin Price Weekly Analysis - Monstrous Decline
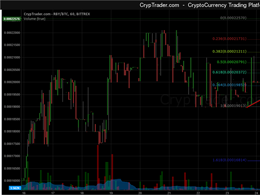
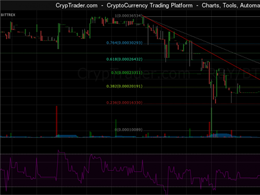
Key Highlights. Rubycoin's price dived down sharply after failing to break a major resistance area near 0.000511 BTC. After breaking a critical support trend line on the 4-hour chart (price feed from Bitfinex), there was a monstrous decline. After recovering a few points higher, the price declined and moved below the 0.00030 BTC support area. Rubycoin's price moved further down. There was an attempt by buyers to take the price higher, but it failed to sustain momentum. 0.0002 BTC as a Support Area. Rubycoin's price slide continued, and there was another leg down taking the price below a....
Related News
RubyCoin Price Key Highlights. Rubycoin price continued to trade higher as it moved closer to 0.0002257BTC. A new weekly high was formed as highlighted during this past week's analysis, and looks set for more gains in the near term. There is a support trend line on the hourly chart of the Rubycoin price, which might act as a buy area. Rubycoin price moved higher this past week, and it looks like it might continue to trade higher moving ahead. Trend Line Support Area. The Rubycoin price moved higher this week, and also cleared the last swing high of 0.00022BTC. The price traded as high as....
Rubycoin Price Key Highlights. Rubycoin price moved back higher after a minor correction and it looks it might test the last high. There is a minor resistance around the last high of 0.0003507BTC, which could be tested and even breached. Buying dips were favored which played well, as the price moved higher after correcting lower. Rubycoin price is showing a lot of bullish signs, and the current price action suggests a new weekly high moving ahead. New High? The Rubycoin moved higher and traded towards the last swing high of 0.0003507BTC. Yesterday, the price corrected lower and moved....
Key Highlights. Rubycoin price continued to move higher as forecasted in one of the previous week's analysis. There was a bearish trend line which was broken to open the doors for more gains in the near term. There is a chance that the price might continue to trade higher and test the last swing high of 0.000365BTC. Rubycoin price stayed in the bullish zone, which means it might head further higher towards the next hurdle at 0.000365BTC. What's Next? The Rubycoin price managed to climb higher recently and even cleared a major bearish trend line on the hourly chart which was acting as a....
Key Highlights. Rubycoin prices finally struggled to clear a major resistance area near 0.000511 BTC and traded lower. There was a major bullish trend line on the 4-hour chart (price feed from Bitfinex), which was broken to ignite a downside move. The price traded as low as 0.00038 BTC, where it found support for another upside reaction. Rubycoin's price is showing a few bearish signs on the 4-hour chart, and if sellers manage to take advantage, there might be another decline. 100 MA as Resistance for RubyCoin Price. Rubycoin prices attempted to break a major resistance area of....
RubyCoin Price Key Highlights. Rubycoin price traded higher and managed to break the last high of 0.0002206BTC. A new weekly high was formed and it looks like the price might continue to trade higher. The broken resistance area might act as a support if the price moves lower from the current levels. Rubycoin price is trading in the bullish zone, and it looks like there is more upsides left in the short term. Can it be broken? The Rubycoin price recently managed to trade higher, and it also broke the previous swing high of 0.0002206BTC. The recent break can be seen as a positive sign, as it....


