Dogecoin Price Technical Analysis For 28/12/2015 - Convincing Break Higher
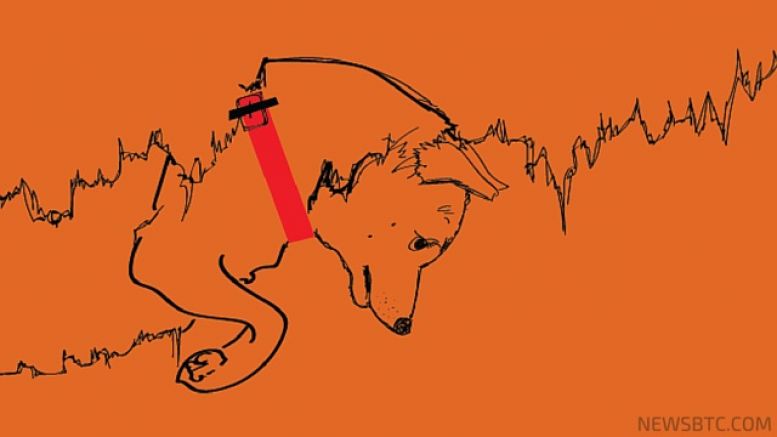
Dogecoin price finally showing a lot of positive signs, which may come as an encouragement for buyers. Recently, the price traded higher and managed to break two important resistances. The first one was the 100 hourly simple moving average and the second one was a bearish trend line formed on the hourly chart (data feed from HitBTC). The price traded as high as 35.1 Satoshis where sellers appeared to defend the upside move. The price is currently correcting lower and finding bids near the 50% Fib retracement level of the last wave from the 29.0 Satoshis low to 35.1 Satoshis high. However,....
Related News

Key Highlights. Dogecoin breached an important bearish trend line as highlighted in yesterday's analysis. More gains are likely if buyers manage to take the price above 72 Satoshis. On the downside, the broken trend line might now act as a support in the near term. We will stick to the plan of buying once there is a convincing break above 72.0 Satoshis moving ahead. How crucial is the trend line break? Yesterday, we highlighted an important bearish trend line on the hourly chart, and were expecting a break above the same. There was an upside move as buyers managed to take the price higher.....

Dogecoin Price Key Highlights. Dogecoin price finally spiked higher and traded above a major bearish trend line. The trend line break was not convincing, and it might be the case that it could be a false one. The price is trading around 100 hourly simple moving average, and if there is a satisfactory close above it more gains are likely. Dogecoin price spiking above the bearish trend line was a good sign, but it might still trade in a range moving ahead. Range Persists? The Dogecoin price after trading for a long time inside a tiny range and below a major bearish trend line managed to....
Key Highlights. Dogecoin price failed to break higher time and again, as there lies a major hurdle for buyers around 72.0 Satoshis. 100 hourly moving average continued to stall gains in the short term and prevented upsides. There is a possibility that the price is forming a triangle breakout pattern on the hourly timeframe. Dogecoin price continued to trade in a range and likely forming a contracting triangle for a break in the near future. What are the chances of a break? Dogecoin price spiked a couple of times above a bearish trend line highlighted in yesterday's analysis. However, there....
Dogecoin Price Key Highlights. Dogecoin price dived lower, and the recent trend line break turned out to be a false one. The price moved below the last low to create a new low around 52.6 Satoshis. 100 hourly simple moving average is acting as a monster resistance, as buyers failed to break it. Dogecoin price moved lower below the last low to open the doors for more losses in the near term may be towards 50.0 Satoshis. Move towards 50.0 Satoshis? We highlighted recently that there might be a false break on the hourly chart of Dogecoin, as there was a trend line break but it was not....
Key Highlights. Dogecoin price struggle continued, as buyers failed to take the price above 80.0. On the downside, the last swing low of 71.8 Satoshis is a major barrier for sellers. Most technical indicators signaling more losses, but none of them is convincing enough. Dogecoin price action was very tricky during this past week, as every technical indicator/signal was not as per trader's expectation. 100 MA as a catalyst. Dogecoin buyers managed to take the price higher on many occasions, but they failed to break a critical resistance area around 78.0-80.0 Satoshis. There is a bearish....