
Bitcoin Price Technical Analysis for 18/01/2016 - Retreating to Broken Support?
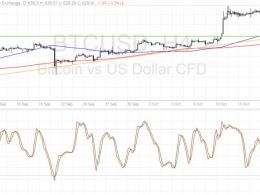
Bitcoin price made a strong break below a long-term consolidation pattern last week but might need to pull back to the nearby areas of interest before resuming its drop to the previous lows or much lower. The 100 SMA is below the 200 SMA, confirming that the path of least resistance is to the downside and that further losses are likely. These moving averages also seem to be edging farther apart, indicating that bearish momentum is strengthening. However, RSI just climbed out of the oversold region, indicating that the recent selloff is already exhausted and that sellers are taking a break....
Related News
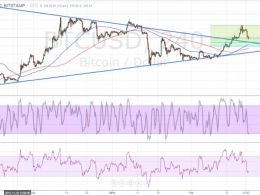
Bitcoin price is retreating from its climb but this might offer bulls an opportunity to restart the rally at better prices. Bitcoin Price Key Highlights. Bitcoin price broke down from the earlier short-term consolidation as predicted in an earlier article. Price is now approaching a longer-term area of interest and potential support visible on the 4-hour chart. There’s a confluence of inflection points all around the $620 level, which might keep losses in check. Technical Indicators Signals. Bitcoin price is trading above a rising trend line visible on its 4-hour time frame, and this....
Bitcoin price might be able to resume its uptrend once it finds more support at the Fibonacci retracement levels. Bitcoin price found resistance at the $450 area and is now retreating to $420, which is the 38.2% Fibonacci retracement level. A larger correction could last until the 50% level at $408.30 or the 61.8% Fib closer to the $400 mark and the moving averages. Speaking of moving averages, the 100 SMA recently made an upward crossover from the 200 SMA, indicating that the path of least resistance is to the upside. This confirms that the uptrend is likely to carry on, probably taking....
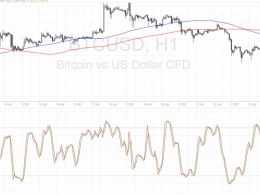
Bitcoin price seems to be establishing a downtrend after confirming a reversal pattern, and technical indicators support this view. Bitcoin Price Key Highlights. Bitcoin price recently formed a head and shoulders pattern on its short-term time frames, signaling that the recent uptrend may be over. Price has broken below the neckline support, which held as resistance on the retest. This adds confirmation that further losses are possible so it’s time to look at the nearby inflection points and areas of interest for potential targets. Technical Indicators Signals. The 100 SMA is still below....
Bitcoin price pulled back from its recent rally and is finding support at a former resistance level. Bitcoin Price Technical Analysis. Bitcoin price is currently testing an area of interest and might be due for a bounce. The broken resistance around $715 is holding as support for the time being. Technical inflection points are also lining up with this area of interest. Technical Indicators Signals. The 100 SMA just crossed above the longer-term 200 SMA so the path of least resistance is to the upside. In addition these moving averages coincide with the former resistance around $715, adding....

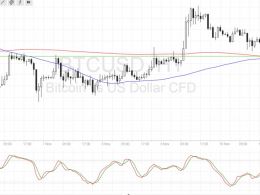
Bitcoin price could be ready to resume its climb now that this area of interest held as support. Bitcoin Price Technical Analysis. Bitcoin price recently made an upside breakout from a near-term resistance around $660. Price has found resistance at the $670 area and has since pulled back to the broken resistance, which appears to have held as support. This signals that bitcoin bulls could be ready to charge once more, although technical indicators are suggesting otherwise. Technical Indicators Signals. The 100 SMA is still below the longer-term 200 SMA so the path of least resistance is to....