Litecoin Price Technical Analysis – Crucial Trend Line Support Area
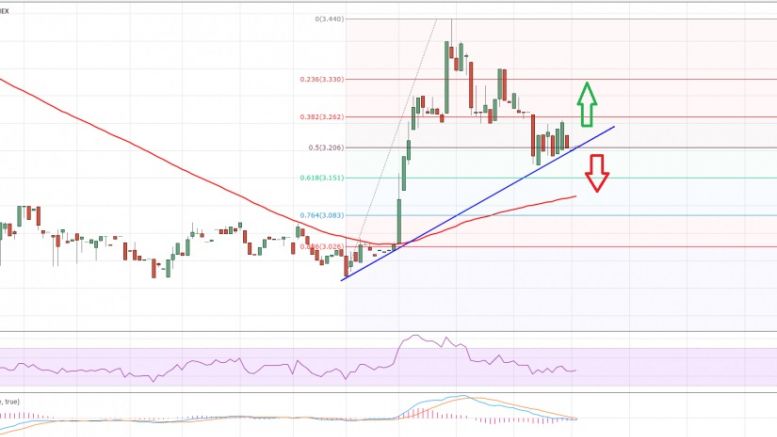
Litecoin price after surging higher found sellers. The $3.50-55 levels acted as a perfect resistance to ignite a short-term correction. Now, can it recover? Intraday Support Level (Bitfinex) can be seen at $3.16. Litecoin price started to correct lower as forecasted in yesterday’s post, as sellers defended the $3.50 level successfully. There is an important trend line and support area formed on the hourly chart (data feed via Bitfinex), which may act as a catalyst for the price moving ahead. Looking at the 2-hours chart (data feed from HitBTC), there was a bearish trend line that prevented....
Related News

Key Highlights. Litecoin price fell sharply and broke a major support trend line formed on the 2-hours chart with data feed from HitBTC. An important support area at $3.50-60 was cleared, which may now act as a resistance if the price corrects higher. There are a lot of bearish signs, suggesting more losses in the near term. Litecoin price failed to move higher and traded lower. Now, since it has cleared the $3.50-60 support area selling rallies are preferred. Sell Rallies? Litecoin price was trading in a nice uptrend until sellers stepped in. We followed a crucial bullish trend line on....
Litecoin price stalled around the $3.30 area. It is currently under a lot of bearish pressure that could result in a sharp downside move. Major Support Level (HitBTC) can be $3.10. Crucial Resistance Level (HitBTC) may be $3.18. Litecoin price after trading as high as $3.20 (data feed via Bitfinex) found resistance and started to move down. There was a lot of selling pressure noted, which resulted in a continuous downside move. There is a bearish trend line formed on the 30-min chart (data feed via Bitfinex), as highlighted in this past week’s analysis. We sold a couple of times around the....

Key Highlights. Litecoin ended the week lower, but found support around an important area of 1.43. A crucial bullish trend line on the 4-hours chart is likely to provide support to LTCUSD. There is a monster bullish trend line formed on the 4H chart of Litecoin, which recently acted as a barrier for sellers and pushed back prices higher. LTCUSD breached the 100 simple moving average (SMA) - 4H to trade above an important resistance around 1.47. However, it struggled at a critical pivot area of 1.50 and fell sharply after testing the mentioned resistance area. The downside stalled at the....

Litecoin price finally managed to find bids near a major support area of $3.50, as it represents a monster barrier for sellers. It acted as a support and resistance both on many occasions, and can be seen as a pivot point for the price. The price after testing the stated support area moved back higher, and currently heading towards a bearish trend line formed on the hourly chart (data feed from Bitfinex). The stated trend line acted as a catalyst for a downside move, and may continue to stall gains in the short term. If buyers need to take the price back towards the last swing high of....

Litecoin price spiked higher and overcame all odds. It looks like there are more upsides left and one may consider buying dips. A Major Support can be at $3.16. A crucial Resistance Level may be $3.28. I highlighted yesterday that the price may move down once again after testing the bearish trend line highlighted in yesterday’s analysis on the 30-mins chart (data feed via Bitfinex) for Litecoin price. The price did move down once, but it found buyers near the all-important $3.00 level. There were many rejections earlier around the stated level, but this time sellers gave completely. As a....