Bitcoin Price Technical Analysis for 03/02/2016 – Trying to Push Past Resistance
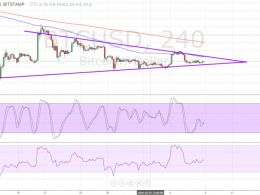
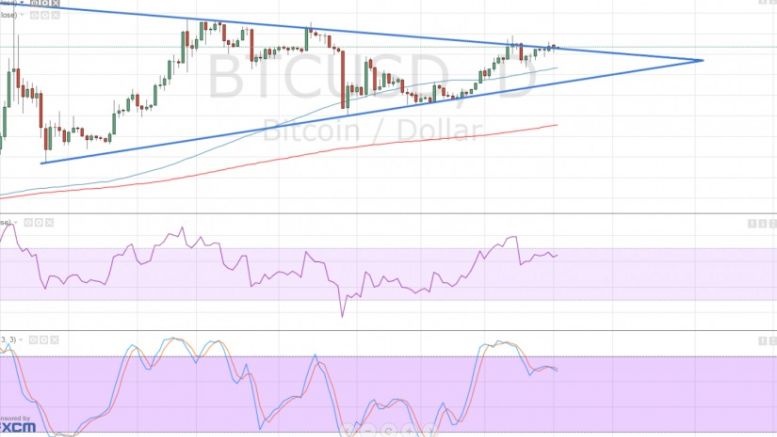
Bitcoin price is trying to make an upside breakout from the symmetrical triangle but another test of support might take place. On the daily time frame, the 100 SMA is safely above the 200 SMA, which suggests that the path of least resistance is to the upside. In addition, the moving averages are edging farther apart so bullish momentum is getting stronger. An upside break from the resistance could lead to a move to the triangle highs at $500 and beyond. The chart pattern is around $200 tall so the resulting rally could last by the same amount. However, stochastic and RSI are on their way....
Related News
Bitcoin price could test the top of the triangle, which might hold as resistance since it coincides with the 100 SMA and is coming off a strong downtrend. The 100 SMA is below the longer-term 200 SMA so the path of least resistance is to the downside. This suggests that the $390-400 area might keep gains in check, pushing bitcoin price back to the bottom of the triangle at $370-375. Stochastic is on its way up, after just making it out of the oversold region. This indicates that bullish pressure is present and that buyers could attempt to push past the triangle resistance. If so, price....
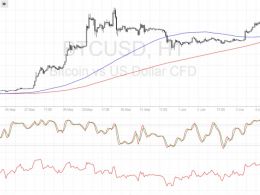
Bitcoin price is gearing up for a strong break of the $600 level, determining if longer-term gains are in the cards. Bitcoin Price Key Highlights Bitcoin price staged such a strong rally on Friday that it’s ready to attempt a break past the latest highs at $600. If this area holds as resistance, bitcoin price could retreat towards support at $550. On the other hand, a move past $600 could put it on track to test the record highs at $1,200. Technical Indicators Signals The 100 SMA is still above the 200 SMA somewhat after nearly making a downward crossover late last week. This signals that....
Bitcoin price could be due for more gains after this upside breakout, possibly aiming for the $750 level next. Bitcoin Price Key Highlights. Bitcoin price made a strong upside break of the near-term resistance marked in a previous article. This suggests that bulls are gaining strength and could push price to the next ceiling. At the moment, bitcoin is testing the area of interest at $700, which is a major psychological level. Technical Indicators Signals. The 100 SMA is above the longer-term 200 SMA so the path of least resistance is to the upside, even on this daily chart. However, the....
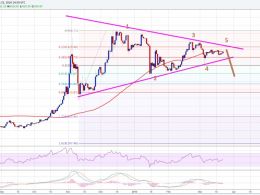
Bitcoin price is eyeing for a break in March 2016. Let us see how it may trade during the remaining part of the week. Intraday Support Level can be $400. Intraday Resistance Level may be $425. Bitcoin price is trading in a range for the past couple of weeks, but if we look at the weekly chart, then we will know that BTCUSD is actually forming a breakout structure. There is a contracting triangle pattern forming on the daily chart (data feed from Bitstamp), which can be seen as a major pattern for the next move in Bitcoin price against the US dollar. If we look at the wave count, then the....
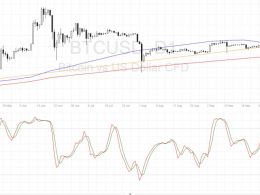
Bitcoin price seems to be set for one more push higher before the end of the year as it successfully took out the $800 barrier. Bitcoin Price Key Highlights. Bitcoin price finally made a convincing break past the $800 barrier, opening the path for further upside targets. Zooming out to the weekly time frame of bitcoin shows the next resistance levels. On a short-term perspective, bitcoin price made it up to the top of the channel illustrated in a previous article. Technical Indicators Signals. The 100 SMA is still above the longer-term 200 SMA on the weekly time frame so the path of least....

