Bitcoin Price Technical Analysis for 03/03/2016 – Breakdown Alert!
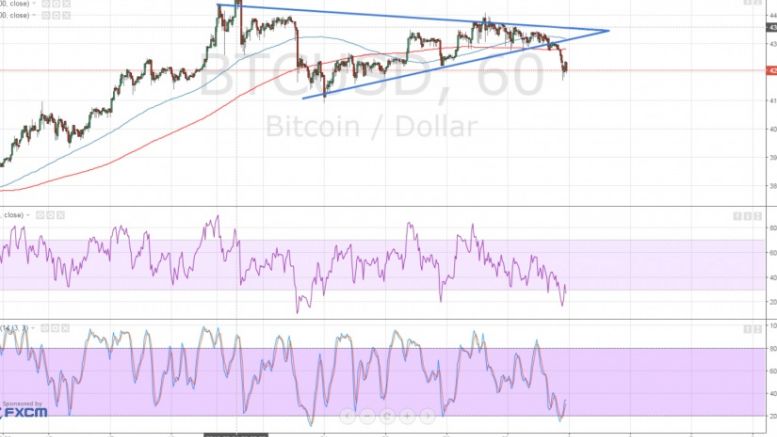
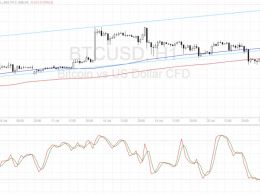
Bitcoin price could be due for more declines after making a downside break of consolidation and forming a reversal pattern. Technical indicators are suggesting a potential bounce for now, with the 100 SMA above the 200 SMA and oscillators moving out of the oversold levels. Both RSI and stochastic are also showing slight bullish divergences, hinting that buyers could come back in the game and trigger a pullback or rally for bitcoin price. A pullback could lead to a test of the broken triangle support near $430 and the moving averages, which might hold as dynamic inflection points. A larger....
Related News
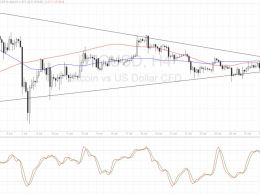
Bitcoin price made a sharp breakdown from consolidation recently, signaling that a longer-term downtrend could take place. Bitcoin Price Key Highlights. Bitcoin price was trading inside a symmetrical triangle pattern before a strong breakdown ensued. An early signal for this selloff materialized on the 1-hour time frame when price broke below a head and shoulders pattern. Economic reports released last Friday seemed to be the main catalyst for the big move. Technical Indicators Signals. The 100 SMA and 200 SMA are still oscillating, as the moving averages have yet to incorporate the recent....
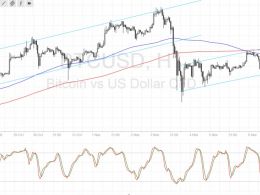
Bitcoin price seems to be done with its climb, as sellers pushed for a break of the near-term channel support. Bitcoin Price Key Highlights. Bitcoin price broke below the ascending channel support on its 1-hour chart, signaling that a reversal from the uptrend is in order. Technical indicators are still showing that the rally could resume at some point. A pullback to the broken channel support could take place before the selloff gains traction. Technical Indicators Signals. The 100 SMA is still above the longer-term 200 SMA so the path of least resistance is still to the upside. However,....
Bitcoin price could be in for a selloff now that it broke below the short-term channel support and is testing the next inflection point. Bitcoin Price Key Highlights. Bitcoin price was previously trending higher on its short-term time frames, moving inside an ascending channel visible on the 30-min and 1-hour charts. Price was rejected on its test of resistance and made its way back down to the channel support as expected. However, this floor broke down, signaling that a reversal from the uptrend may be in order. Technical Indicators Signals. The 100 SMA is still above the longer-term 200....
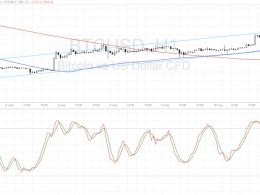
Bitcoin price looks ready for a selloff but a quick correction from the breakdown might take place first, giving bears a better entry point. Bitcoin Price Key Highlights. Bitcoin price recently broke below the ascending channel support, signaling that a reversal from the uptrend is about to take place. Price bounced off the $660 area and appears to be making a correction from here. Bitcoin could retest the broken support around the $670-675 levels before resuming its slide. Technical Indicators Signals. The 100 SMA is still above the longer-term 200 SMA for now so the path of least....
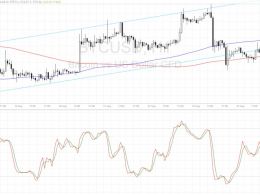
Bitcoin price is stuck in a tighter consolidation pattern, which could set the tone for an even more explosive breakout. Bitcoin Price Technical Analysis. Bitcoin price is starting to form a new ascending channel after its previous breakdown. The consolidation is noticeably tighter these days, which suggests that price could be gearing up for a strong breakout. The US elections would likely have a strong impact on financial market sentiment and dollar price action. Technical Indicators Signals. The 100 SMA just crossed below the longer-term 200 SMA so the path of least resistance is now to....