Ethereum Price Technical Analysis 03/07/2016 – Target Additional Gains
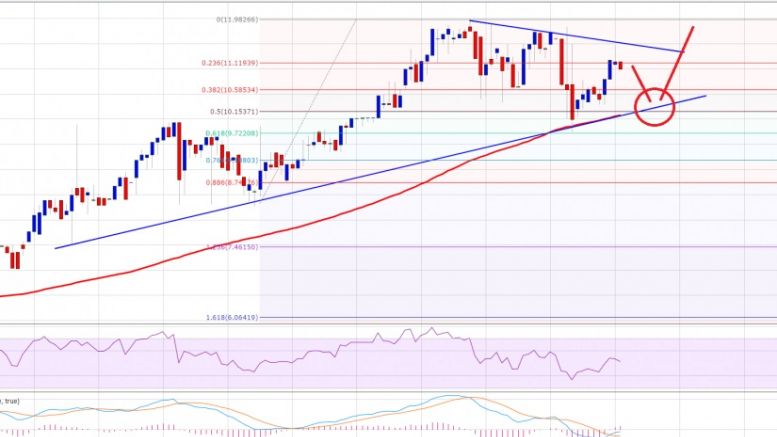
Ethereum price rocketed past $11.00 during the past session. It looks like buying dips is the most fruitful idea in the near term. Intraday Support Level may be $11.20. Intraday Resistance Level can be $11.80. Ethereum price after closing the week above $10.0 found support once again and traded higher. I was anticipating a test of $11.00, and the price did break the stated level. A new high of $11.98 was formed, and it looks like there is a chance that the price may trade back higher once again. There was a minor correction noted after the price almost traded close to the $12.0 handle.....
Related News
Bitcoin rises more than 2 percent to $430.21, nearing our year-end target of $440. In the previous price technical analysis A No Trade Market, we mentioned that an increasing MFI often causes price appreciation, and we are witnessing just that. The question now is: Would bitcoin be able to extend the gains or will it retrace its steps? Let us try to predict this with the help of technical analysis conducted on the 240-minute BTC-USD price chart. Bitcoin is well poised to increase its duration inside the $400-440 range, at least for the next couple of sessions. There is a high probability....
Ethereum price gained heavily once again. It looks like there is a chance of more upsides if the bulls remain in control. Intraday Support Level can be $7.10. Intraday Resistance Level may be $7.75. Ethereum price consolidated for a brief period during the past couple of sessions, and finally broke higher. I highlighted a contracting triangle pattern on the hourly chart (data feed via Kraken) yesterday and suggested to wait for a break to enter a trade. The price did move higher and breached a major resistance area of $6.60. After the break, there was a nice upside move that took the price....
Ethereum price seems to have its sights set higher after breaking out of a descending triangle on its 4-hour chart. Technical indicators are also supporting further gains. Ethereum price had previously consolidated inside a descending triangle pattern, forming lower highs and finding support at 0.00250. At the moment, ethereum price is testing the near-term resistance at the 0.00300 level, waiting for more bulls for another leg higher. An upside break past this level could take it up to the next area of interest at 0.00330-0.00350 then onwards to the larger triangle highs at 0.00400.
Ethereum price tumbled recently, and traded towards $8.00. It was a perfect sell, and it looks like the bulls may be exhausted. Ethereum price ETH was down and out, as there was a sharp downside move towards the $8.00 support area. I mentioned in my previous analysis that there is a chance of a decline in ETH/USD due to the technical indicators. It was a perfect sell, and the final target of $8.0 was achieved. There was a bearish trend line on the hourly chart (data feed via Kraken) of ETH/USD, which acted as a perfect catalyst for a decline. The price traded below $8.0, and a new low of....
Bitcoin price advance started gaining momentum toward the end of the current wave. Analysis shows price may make an additional high and if the previous acceleration continues, price may continue surprising despite strong technical indications requiring it to cool down. This analysis is provided by xbt.social with a 3 hour delay. Read the full analysis here. Not a member? Join now and receive a $29 discount using the code CCN29. Bitcoin Price Analysis. Time of analysis: 15h00 UTC. Bitfinex 1-Hour Chart. From the analysis pages of xbt.social, earlier today: Magenta line annotations show the....


