Bitcoin Price Technical Analysis for 03/07/2016 – Test of Triangle Support
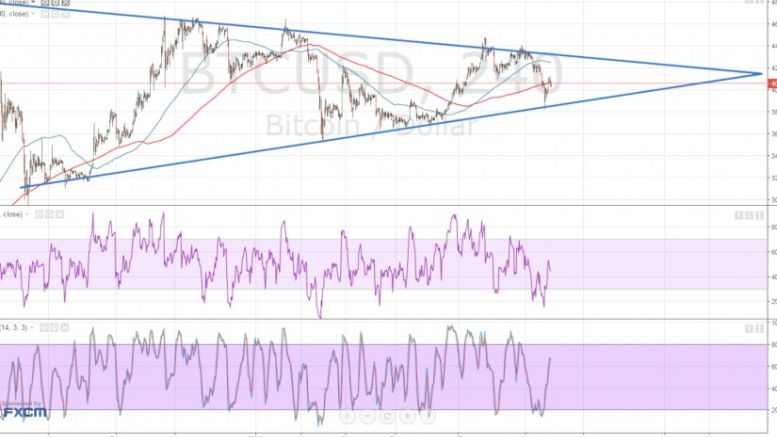
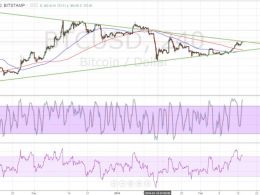
Bitcoin price just came off a test of the triangle support and might be due for another move towards resistance. The 100 SMA is above the 200 SMA, signaling that the path of least resistance is to the upside. Stochastic is on the move up, which also confirms that buyers are in control of price action for now, likely pushing for a test of the triangle top around $420-430. RSI is also heading north so price might follow suit. Stronger bullish pressure might even lead to an upside break of the triangle resistance and a prolonged uptrend for bitcoin price. In that case, price could resume its....
Related News
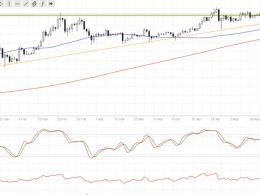
Bitcoin price is still inside its long-term triangle consolidation pattern and might make another test of the resistance. Bitcoin Price Key Highlights. Bitcoin price has formed higher lows and found resistance at the $470 level, creating an ascending triangle pattern on its daily chart. Price just bounced off the triangle support and is due for a test of resistance once more. Technical indicators are signaling that further gains are possible. Technical Indicators Signals. The 100 SMA is above the 200 SMA so the path of least resistance is still to the upside. A sharp move lower could find....
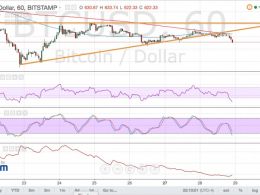
Bitcoin price broke below its triangle support to indicate that the selloff isn’t over yet. Bitcoin Price Key Highlights. Bitcoin price was trading inside an ascending triangle pattern as illustrated in a previous article. Price broke below support, indicating a pickup in bearish momentum and a likely drop to the triangle lows around $580. Technical indicators are also suggesting that further declines are possible. Technical Indicators Signals. The 100 SMA is below the 200 SMA so the path of least resistance is still to the downside. In addition, these moving averages held as dynamic....
Bitcoin price could test the top of the triangle, which might hold as resistance since it coincides with the 100 SMA and is coming off a strong downtrend. The 100 SMA is below the longer-term 200 SMA so the path of least resistance is to the downside. This suggests that the $390-400 area might keep gains in check, pushing bitcoin price back to the bottom of the triangle at $370-375. Stochastic is on its way up, after just making it out of the oversold region. This indicates that bullish pressure is present and that buyers could attempt to push past the triangle resistance. If so, price....
Bitcoin price is stalling right on the symmetrical triangle resistance, still deciding whether to make a bounce or a break. The 100 SMA is below the 200 SMA on the 4-hour time frame, indicating that the path of least resistance is to the downside. This means that the triangle resistance is likely to keep gains in check, forcing bitcoin price to turn back south and make a test of the support at $380. Stochastic is indicating overbought conditions, although the oscillator hasn’t turned down from the 80.0 level yet. RSI, on the other hand, is already on the move down so bearish momentum might....
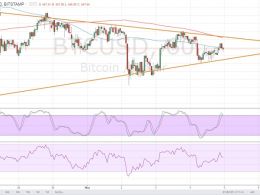
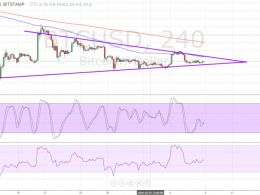
Bitcoin price is moving inside a symmetrical triangle consolidation pattern and is on track towards testing the resistance. The 100 SMA is below the longer-term 200 SMA, confirming that the path of least resistance is to the downside and that the triangle resistance near $450 is likely to hold. In addition, the 200 SMA lines up with the top of the triangle as a dynamic resistance level. For now, price is encountering some resistance at the 100 SMA and if this holds, another test of the support could take place. Stronger selling momentum might even trigger a downside breakout. Stochastic....