Ethereum Price Technical Analysis 03/08/2016 – Bears Take Note
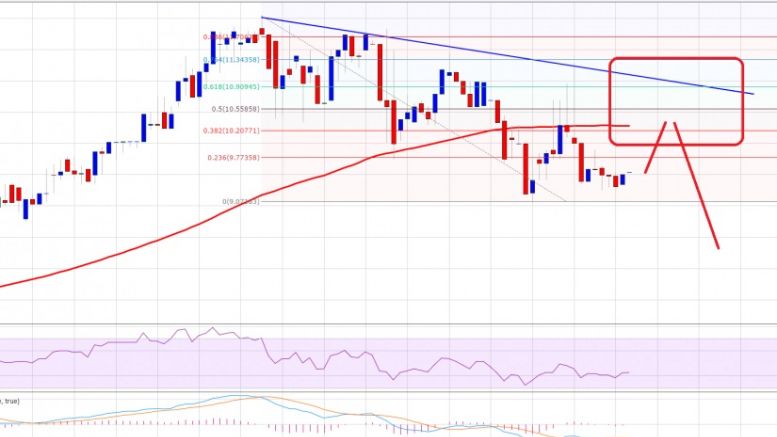
Ethereum price traded down finally and also moved back below $10.0. It looks like there is a chance of a minor correction moving ahead. Intraday Support Level can be $9.07. Intraday Resistance Level may be $10.5. Ethereum price as highlighted yesterday made a new high of $11.98 where it found sellers and started to move down. The price also traded below the $10.0 level, which is a sign that bulls stepped back and failed to prevent losses. If the bears manage to gain strength, then there is a chance of more losses in the near term.
Related News

The bear market has been quite harsh to all major altcoins including Ethereum. Over the past 24 hours ago, the coin dipped by 4%. In the last week however, Ethereum tried to stage a recovery. The bears continued to drag prices down despite that. Buyers of Ethereum have tried to remain calm throughout most of the downswing. The consistent push by the bears have caused the altcoin to experience less to almost no recovery. The technical of the coin also pointed towards further fall in price before Ethereum starts to rise on the chart again. In the recent developmental front, the altcoin has....
Ethereum classic price struggled during the late part of August 2016 against Bitcoin, and it may remain under pressure in the near term. Key Highlights. Ethereum classic price after an impressive run during the start of August against Bitcoin failed to sustain momentum. It looks like the ETC/BTC pair is forming a consolidation pattern on the 4-hours chart (data feed via Simplefx). On the upside, there is a major resistance near 0.0035BTC, and on the downside support lies at 0.0022BTC. Ethereum Classic Price Range. Ethereum classic price after trading as high as 0.0063BTC against Bitcoin in....

Ethereum Price Key Highlights. Ethereum's price recently broke below a key support area, signaling that a downtrend might be underway. Before the selloff carries on, Ethereum's price is showing signs of a correction to the broken support zone. Using the Fibonacci retracement tool on the latest swing high and low shows that the 38.2% to 50% levels line up with the broken support on Ethereum price. Support Turned Resistance. If the area of interest holds as resistance, the Ethereum price could make its way back down to the previous lows at 0.0017 BTC. The 100 Simple Moving Average also....

Ethereum Price Key Highlights. The downtrend on ethereum price action appears to be slowing down, as bears don't seem to be too eager to take it down to new lows. After breaking below the earlier triangle consolidation pattern, ethereum price seems to be losing momentum and might be in for a short squeeze around the recent levels. Ethereum price might need to make a correction from its recent drop in order to draw more sellers to push for new lows. RSI Bullish Divergence. Technical indicators appear to be showing that a rally is about to take place, as RSI is reflecting downtrend....

Ethereum price attempted a break yesterday, but failed. It looks like ETH/USD bears may step in to take the price towards $9.00. Ethereum price ETH traded above the 100 hourly simple moving average for some time, but failed to gain traction. As a result, the price moved down, and there was even a close below the 100 hourly SMA. I highlighted a bearish trend line formed on the hourly chart (data feed via Kraken) of ETH/USD yesterday, and was hoping for a break. However, the ETH bulls failed to break the trend line resistance, and the price moved down. Now, since there is an hourly close....