Ethereum Price Technical Analysis 03/16/2016 – Eyeing $14.20-50
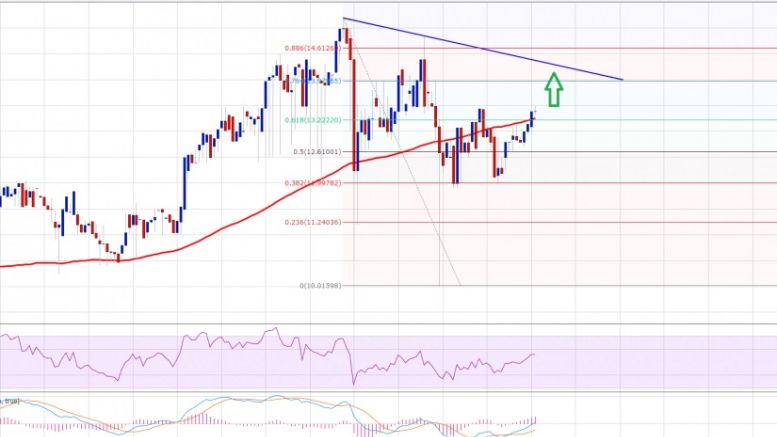
Ethereum price started to move higher. And, if the bulls remain in action there is a chance of a retest of the $14.20-50 resistance area. Intraday Support Level can be $13.00. Intraday Resistance Level may be $14.20. Ethereum price declined in the 3rd wave to trade near the $12.00 support area, which acted as a perfect buy zone and pushed the price back higher. The price is currently under a minor divergence, suggesting more gains. There is a two point resistance trend line forming on the hourly chart (data feed via Kraken), which can be seen as the next stop for the price. The price has....
Related News
Ethereum Price Key Highlights. Upon breaking below the bottom of the rising wedge consolidation pattern recently, ethereum price has its sights set on new lows. Technical indicators suggest that the selloff is gaining traction but that a pullback to the broken support zones might still be possible. Ethereum price is eyeing further downside and might be ready to test the yearly lows as seen on the 4-hour time frame. Bearish Pressure Rising. Bitcoin price has broken to the upside of its consolidation pattern, which may have been partly to blame for the downside break in ETHXBT. The chart....
Bitcoin price has shown strong upside momentum over the past few weeks and might be eyeing a test of these next ceilings. Bitcoin Price Key Highlights. Bitcoin price made another break higher over the weekend, indicating strong bullish momentum. Price is now testing another long-term area of interest around $700, at which either profit-taking or another upside breakout might be seen. Technical indicators are hinting that the rallies could pause but it would be helpful to look at the next potential resistance levels. Technical Indicators Signals. The 100 SMA is above the 200 SMA for now so....
Ethereum price looks like created a short-term top. A move below the $12.00 area may take the price towards the $10.50 support area. Intraday Support Level can be $11.80. Intraday Resistance Level may be $14.50. Ethereum price spiked on more time during the past couple of sessions, and traded as high as $15.16. There was a strong selling pressure noted around the stated level that took the price down. The last couple of 4-hours candles are very bearish, and suggesting that the bulls struggled to compete with the bulls. The price already traded near a bullish trend line formed on the....
Ethereum price seems to have its sights set higher after breaking out of a descending triangle on its 4-hour chart. Technical indicators are also supporting further gains. Ethereum price had previously consolidated inside a descending triangle pattern, forming lower highs and finding support at 0.00250. At the moment, ethereum price is testing the near-term resistance at the 0.00300 level, waiting for more bulls for another leg higher. An upside break past this level could take it up to the next area of interest at 0.00330-0.00350 then onwards to the larger triangle highs at 0.00400.
Bitcoin price is eyeing for a break in March 2016. Let us see how it may trade during the remaining part of the week. Intraday Support Level can be $400. Intraday Resistance Level may be $425. Bitcoin price is trading in a range for the past couple of weeks, but if we look at the weekly chart, then we will know that BTCUSD is actually forming a breakout structure. There is a contracting triangle pattern forming on the daily chart (data feed from Bitstamp), which can be seen as a major pattern for the next move in Bitcoin price against the US dollar. If we look at the wave count, then the....


