Bitcoin Price Technical Analysis for 03/18/2016 – Channeling Higher!
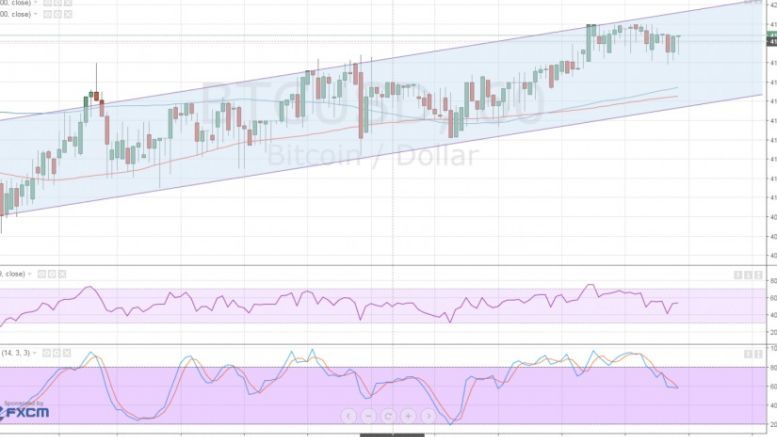
Bitcoin price has started a steady uptrend and might carry on, based on the new signals from technical indicators. The 100 SMA just crossed above the longer-term 200 SMA to confirm that the path of least resistance is to the upside. However, the channel resistance appears to be holding so a pullback to these dynamic support areas near the bottom of the channel might take place. RSI is on its way down, indicating that bitcoin price bears are in control of price action for now. In that case, a quick drop to the channel bottom is indeed possible, as stochastic is also heading down from the....
Related News
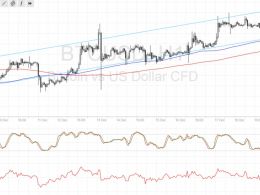
Bitcoin price has been crawling slowly higher as bulls are looking exhausted but are refusing to let up. Bitcoin Price Key Highlights. Bitcoin price is still on its uptrend, moving inside what appears to be either a rising wedge or an ascending channel on its 1-hour chart. Price is in the middle of the formation but looks ready for a test of support. Technical indicators are suggesting that the climb could carry on. Technical Indicators Signals. The 100 SMA is above the longer-term 200 SMA so the path of least resistance is to the upside. Also, the gap between the moving averages is....
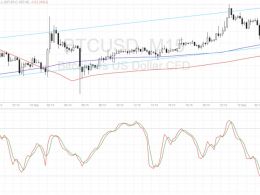
Bitcoin price could keep going for gains as the bullish channel on the short-term charts is staying intact. Bitcoin Price Key Highlights. Bitcoin price is still trending higher, moving inside a short-term bullish channel on its 15-minute time frame. Price is hovering around the middle of the channel, still deciding whether to make a test of support or climb back to the resistance. Technical indicators are suggesting that the uptrend could carry on. Technical Indicators Signals. The 100 SMA is above the 200 SMA on this time frame, confirming that the path of least resistance is to the....
Ethereum price seems to have its sights set higher after breaking out of a descending triangle on its 4-hour chart. Technical indicators are also supporting further gains. Ethereum price had previously consolidated inside a descending triangle pattern, forming lower highs and finding support at 0.00250. At the moment, ethereum price is testing the near-term resistance at the 0.00300 level, waiting for more bulls for another leg higher. An upside break past this level could take it up to the next area of interest at 0.00330-0.00350 then onwards to the larger triangle highs at 0.00400.
Litecoin falls 1.47 percent to $3.075 after kissing the resistance at $3.130. In the previous Litecoin price technical analysis, we said that Litecoin could leapfrog to higher levels on consistent support from the buyers, but what we have got instead is a bout of profit booking which once pulled down the price to an intraday low of $3.050. But can this decline prove fatal to Litecoin? Will the crucial support of $3.000 be breached? Let us try to find that out by conducting a technical analysis on the daily LTC-USD price chart. Litecoin Chart Structure - As can be seen, the higher top,....
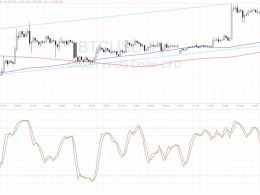
Bitcoin price could be due for a test of the channel support once more, with technical indicators confirming a potential bounce. Bitcoin Price Key Highlights. Bitcoin price is still inside its ascending channel pattern after getting rejected on its attempt to break past the resistance. Price could be headed for the channel support for another bounce higher. Technical indicators suggest that the uptrend could carry on. Technical Indicators Signals. The 100 SMA lines up with the channel support around $665, adding to its strength as a potential floor. In addition, the 100 SMA is safely above....


