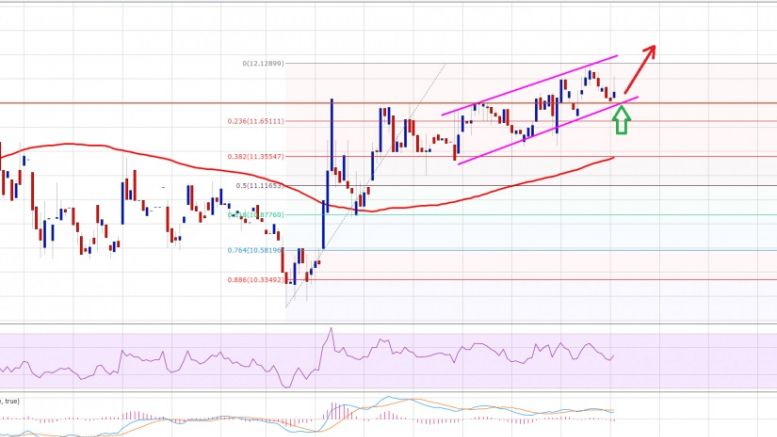
Ethereum Price Technical Analysis 03/31/2016 – Resistance Turned Support
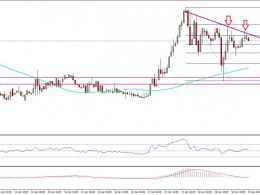
Ethereum price popped above a major resistance area of $11.80. Now, can it provide support and push ETH higher versus the USD? Ethereum price kept struggling near the $11.80 resistance area, as highlighted in yesterday’s post. However, the ETH bulls finally managed to take the price above the stated level, and there was an hourly close above it. Now, the price is moving down, and the same resistance area is currently acting as a support and helping the bulls to regain ground. There is an ascending channel pattern formed on the hourly chart (data feed via Kraken) of ETH/USD, which may play....
Related News
Bitcoin price is hovering above a resistance turned support area visible on the short-term time frames, still deciding whether to make a bounce or a break. Bitcoin Price Key Highlights. Bitcoin price is still treading sideways, moving above a resistance turned support level at $602. Price has formed lower highs on the 15-minute chart, suggesting that bullish pressure is weakening and that bears are trying to push for a move lower. For now, the area of interest is holding quite well since it lines up with the 100 SMA dynamic support. Technical Indicators Signals. The 100 SMA just recently....
Bitcoin price pulled back from its recent rally and is finding support at a former resistance level. Bitcoin Price Technical Analysis. Bitcoin price is currently testing an area of interest and might be due for a bounce. The broken resistance around $715 is holding as support for the time being. Technical inflection points are also lining up with this area of interest. Technical Indicators Signals. The 100 SMA just crossed above the longer-term 200 SMA so the path of least resistance is to the upside. In addition these moving averages coincide with the former resistance around $715, adding....
Bitcoin price is trending lower but is making a correction to an area of interest before resuming the selloff. Bitcoin Price Key Highlights. Bitcoin price recently broke below a short-term support area visible on the 1-hour time frame. Price found support around the $565 area before showing signs of pulling back. Bitcoin is now approaching the former support zone around $575, which might now hold as resistance. Technical Indicators Signals. The 100 SMA is below the 200 SMA so the path of least resistance is to the downside, which means that the downtrend could carry on. The 100 SMA is....
Ethereum price dived yesterday towards $9.60 against the US Dollar, but found support, and it looks like ETH/USD may attempt to trade higher. Key Highlights. ETH price corrected lower further against the US Dollar, but found support near $9.60. There is a connecting bearish trend line formed on the hourly chart (data feed via SimpleFX) of ETH/USD, which is currently acting as a resistance near $10.05. The price remains supported on the downside, as an earlier resistance is now acting as a barrier for sellers near $9.60. Ethereum Price Resistance. There was a downside extension yesterday in....

Ethereum Price Key Highlights. Ethereum's price recently broke below a key support area, signaling that a downtrend might be underway. Before the selloff carries on, Ethereum's price is showing signs of a correction to the broken support zone. Using the Fibonacci retracement tool on the latest swing high and low shows that the 38.2% to 50% levels line up with the broken support on Ethereum price. Support Turned Resistance. If the area of interest holds as resistance, the Ethereum price could make its way back down to the previous lows at 0.0017 BTC. The 100 Simple Moving Average also....