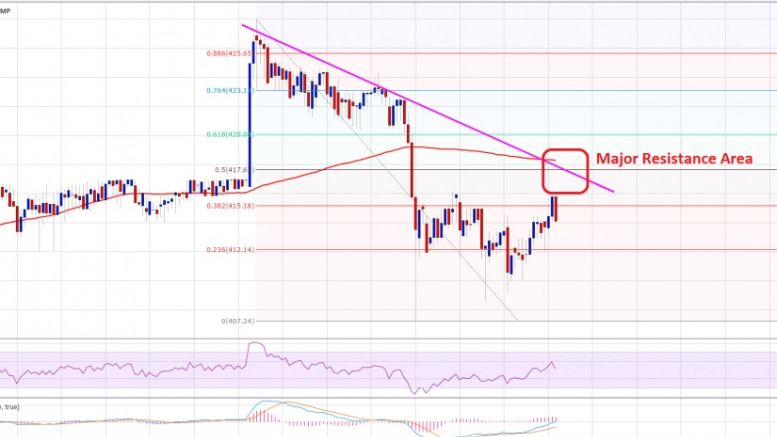
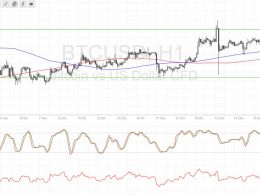
Bitcoin Price Technical Analysis For 03/31/2016 – BTC/USD Approaching Resistance
Bitcoin price is currently correcting higher, but facing an important hurdle on the upside. Can BTC/USD manage to break $417 and gain further? As highlighted in yesterday’s post, Bitcoin price started to correct higher after trading as low as $407. However, the current recovery in BTC/USD won’t be an easy ride, as there is a monster barrier formed on the upside for the BTC buyers. There is a confluence resistance area forming near a bearish trend line on the hourly chart (data feed from Bitstamp). The highlighted trend line resistance is positioned with the 100 hourly simple moving....
Related News
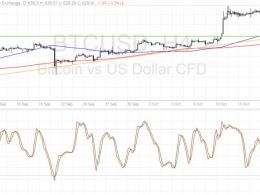
Bitcoin price is retreating from its climb but this might offer bulls an opportunity to restart the rally at better prices. Bitcoin Price Key Highlights. Bitcoin price broke down from the earlier short-term consolidation as predicted in an earlier article. Price is now approaching a longer-term area of interest and potential support visible on the 4-hour chart. There’s a confluence of inflection points all around the $620 level, which might keep losses in check. Technical Indicators Signals. Bitcoin price is trading above a rising trend line visible on its 4-hour time frame, and this....
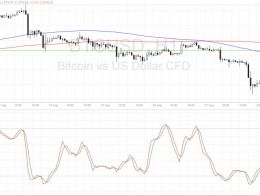
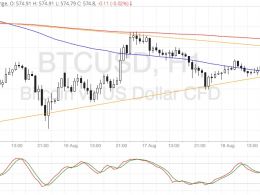
Bitcoin price is trending lower but is making a correction to an area of interest before resuming the selloff. Bitcoin Price Key Highlights. Bitcoin price recently broke below a short-term support area visible on the 1-hour time frame. Price found support around the $565 area before showing signs of pulling back. Bitcoin is now approaching the former support zone around $575, which might now hold as resistance. Technical Indicators Signals. The 100 SMA is below the 200 SMA so the path of least resistance is to the downside, which means that the downtrend could carry on. The 100 SMA is....
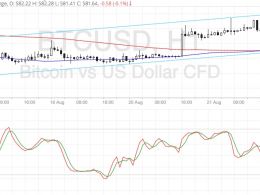
Bitcoin price could be due for a bounce off the channel support, with technical indicators reflecting the presence of buying momentum. Bitcoin Price Key Highlights. Bitcoin price has been steadily climbing on its 1-hour chart, moving inside an ascending channel pattern. Price bounced off the top of the channel once more and is now making a move towards support. If this area holds as a floor once more, bitcoin price could make its way back up to the channel resistance. Technical Indicators Signals. The 100 SMA just crossed above the 200 SMA to indicate that the path of least resistance is....
Bitcoin price could continue to trade sideways as the Christmas holidays are approaching and volumes might be turned down. Bitcoin Price Key Highlights. Bitcoin price seems to be moving sideways recently, possibly establishing its range for the remainder of the year. Volatility has been subdued again after the FOMC statement led to a sharp rally for the dollar then a quick reversal. Bitcoin price found support around $765 and resistance at $795. Technical Indicators Signals. The 100 SMA is still above the longer-term 200 SMA so the path of least resistance is to the upside. Bitcoin price....
Bitcoin price looks ready to break out of its symmetrical triangle consolidation pattern, which could determine its longer-term direction. Bitcoin Price Key Highlights. Bitcoin price has been stuck in consolidation for a while, forming lower highs and higher lows inside a symmetrical triangle pattern. Price is currently testing support and is approaching the peak of the pattern, which suggests that a breakout could take place soon. Technical indicators seem to be favoring a downside move at this point. Technical Indicators Signals. The 100 SMA is still below the 200 SMA so the path of....