Litecoin Price Weekly Analysis – Further Gains Seem Likely
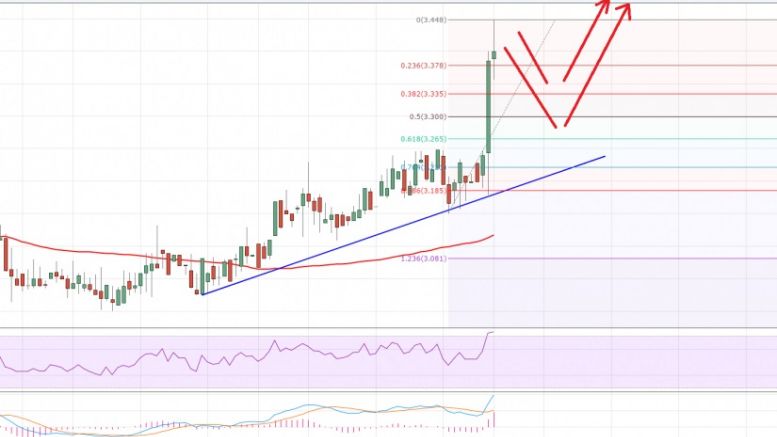
Litecoin price climbed higher this past week and showed a lot of bullish signs. It looks like buying dips idea may work in the near term. Intraday Support Level can be $3.33. Intraday Resistance Level may be $3.45. Litecoin price after trading near the $3.00 support area for a long time formed a base and started to move higher. The upside move was very strong, as the price cleared 100 simple moving average on the 4-hours chart (data feed via Bitfinex), and tested the $3.45-50 area. The last couple of H4 candles are very bullish, and pointing towards the fact that buyers are in control.
Related News
If there was a competition right now between our beloved hero Superman and the cryptocurrency Litecoin, I think even our iconic hero would say for once “Okay, let's catch a break!” Litecoin is breaking all the fathomable boundaries, having jumped from $2 to more than $8 in just the past 4 weeks. And with momentum and trend remaining overtly bullish, there is no saying what valuations we will see going ahead. Litecoin has jumped a massive, a phenomenal 31% in the past 24 hours to leapfrog to $8.100. In today's analysis, we are taking a departure from the normal routine in a way that a....
Litecoin (LTC) has continued to range in a channel against Tether (USDT) as it attempts to break out of this trend. The price of Litecoin LTC has shown little to no major movement despite the change in trend across the market in recent weeks as many altcoins rallied and produced gains of double digits. (Data from Binance) Related Reading: When Will Bitcoin Become An Inflation Hedge? Scaramucci Explains Litecoin (LTC) Price Analysis On The Weekly Chart From the chart, the price of LTC saw a weekly low of $45, which bounced from that area and rallied to a price of $56; considering its....
Key Highlights. Litecoin price surged higher and traded close to $9.00 where there was a major selling interest. The price declined heavily and fell by more than 25% to trim most of its gains. Buyers managed to take prices higher, but they failed to maintain gains which ignited a downside reaction. Litecoin price once again moved higher as forecasted in this past week's weekly analysis. There was a sharp upside move taking the price towards $9.00. The price failed miserably around the mentioned resistance area, which ignited a downside move. Importance of a bullish trend line. There is a....
Litecoin has jumped another 12% since yesterday, adding to its surreal gains and decimating the bears. In my previous analysis, I had recommended shorting the cryptocurrency near $5.300 by placing a stop-loss above $5.500 and Litecoin has proved me wrong. Litecoin is currently trading up 12.41% at $5.379. Technically, Litecoin looks formidable even at these outrageous levels. The 240-minute LTC-USD price chart indicates strong bullish force behind the rise and it has become incredibly difficult for me to comment as to when the profit booking will come in or when the market would realize....
Litecoin Price Key Highlights. Litecoin price held the ground as highlighted in the previous week's analysis that the $2.40 support area holds the key. A bearish trend line formed on the 4-hours chart of the Litecoin price was breached to open the doors for more gains in the near term. Litecoin price has managed to break a major resistance area, which might ignite an upside rally moving ahead. Retest of $3.80? The Litecoin price found support around $2.40, which acted as a major hurdle for sellers and prevented more losses. There was an upside move recently, as the price managed to break....


