Bitcoin Price Weekly Analysis: Signaling Bullish Continuation
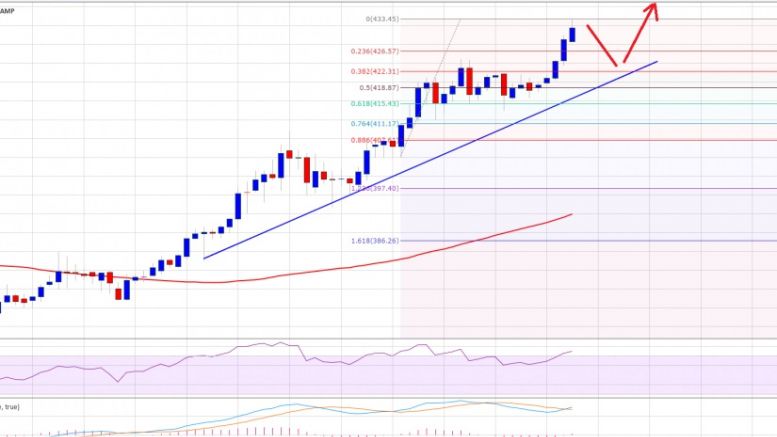
Bitcoin price climbed higher this past week. And, looking at the current market sentiment there is a chance of more upsides in the short term. Major Support Level may be $422. Major Resistance Level can be $435. Bitcoin price enjoyed a decent upside move this past week, as buyers were successful in taking it above the $400 resistance area. The stated level acted as a hurdle for them on many occasions, and a weekly close above it means a lot of optimism. The price traded a few points above the $430 level, and it looks like the price may trade down or correct in order to gain bids in the....
Related News

Bitcoin price continued to rise yesterday scoring a high of $244. The pattern of the new bullish wave has been established as we explained during our yesterday's "intraday tips" article. By analyzing the 1 day Bitfinex (BTC/USD) charts and plotting the RSI and the 20 day EMA accordingly (look at the below chart), we can conclude the following: The current bullish trend can be viewed as a continuation of the bullish wave that started on the 15th of January, if we consider that the first bullish rally had been halted by a price correction wave that triggered sideways movements for a few....

The XRP price has been one of the best altcoin performers over the last few months, going from below $0.6 to over $2.8 in this time period. Nevertheless, like the rest of the crypto market, the altcoin recently succumbed to bearish pressure, pushing it back toward $2. Despite this, the XRP price has continued to show strength, and recent developments on the altcoin’s chart show that the bullish momentum is far from over. XRP Price Shows Bullish Continuation So far, the XRP price has been ranging in a tight channel as bulls have maintained a tight hold on the $2 support. A crypto analyst on....
The Waves protocol (WAVES) price has remained in a channel against Tether (USDT) as it attempts to break out of this trend. Despite the recent shift in the market trend, Waves protocol (WAVES) has shown little to no significant movement, as many altcoins rallied and produced double-digit gains. (Binance data) Related Reading: Bitcoin Trading Hikes On DBS Digital Exchange Despite Crypto Winter The Weekly Chart Analysis For WAVES Protocol (WAVES) According to the chart, WAVES hit a weekly low of $4.2, then bounced back to $5. Considering its all-time high of more than $60, this isn’t....
Bitcoin’s price action has managed to break above $115,000 after spending the majority of the past two weeks trading below this level. Bitcoin is now holding firm above $114,000, and the leading cryptocurrency has regained momentum over the past week that shows signs of renewed bullish strength. According to technical analysis, a hidden bullish divergence is forming with the recent price action this week, and this could be the setup that pushes Bitcoin to new price highs. Bitcoin Revealing Hidden Bullish Divergence Technical analysis of Bitcoin’s weekly candlestick timeframe....
Bitcoin price has formed a three white soldiers pattern on its weekly chart, confirming that further gains are in the cards. Bitcoin Price Key Highlights. Bitcoin price could be in for a continuation of its bullish run after this chart pattern formed on its weekly time frame. A three white soldiers formation can be seen with those three bullish candlesticks after a brief period of consolidation. This signals that buyers aren’t done with their rallies, potentially taking bitcoin price to the next area of interest at $800-850 then onto $900-1,000. Technical Indicators Signals. The 100 SMA is....