Ethereum Price Technical Analysis 04/04/2016 – Breakout Approaching?
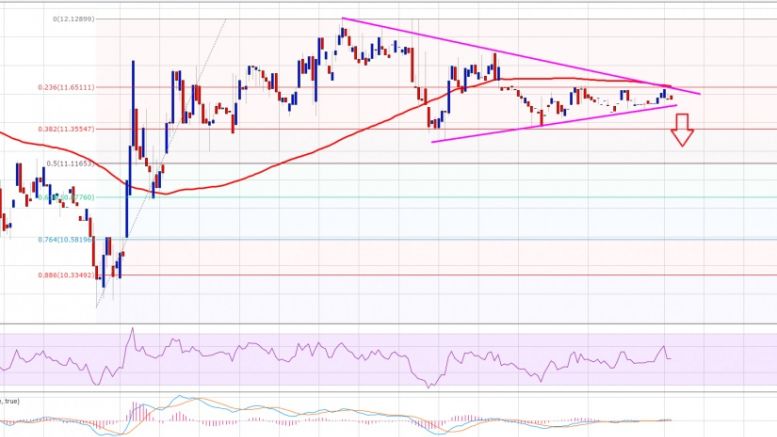
Ethereum price is struggling to trade higher, and approaching a short-term breakout. Can sellers succeed or the bulls will overcome selling pressure? Ethereum price after failing to break the $12.12 level against the US Dollar moved down, and showed a lot of bearish signs lately. The price closed below the 100 hourly simple moving average as well, which suggests that the bulls are struggling to take the price higher. There is a contracting triangle pattern forming on the hourly chart (data feed via Kraken) of ETH/USD, which may be seen as a catalyst for the next move. The highlighted....
Related News
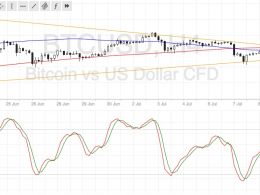
Bitcoin price is still stuck in consolidation but might be ready to make a strong breakout in either direction sooner or later. Bitcoin Price Key Highlights. Bitcoin price formed higher lows and lower highs, creating a symmetrical triangle pattern on its 4-hour time frame. Price is still stuck inside that triangle pattern for now but a breakout might be due since it is approaching its peak. A breakout in either direction could set the longer-term trend for bitcoin. Technical Indicators Signals. The 100 SMA is currently below the 200 SMA, signaling that the path of least resistance is to....
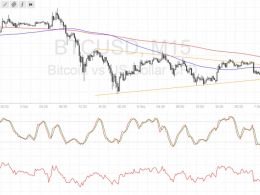
Bitcoin price is stuck in consolidation on its short-term time frames but could be poised for a breakout soon. Bitcoin Price Key Highlights. Bitcoin price has been treading sideways recently and has formed a symmetrical triangle formation on its 15-minute chart. A breakout could be due sooner or later since price is approaching the triangle’s peak. Technical indicators are giving mixed signals on this time frame but longer-term charts suggest that the uptrend could remain intact. Technical Indicators Signals. The 100 SMA is below the longer-term 200 SMA on this chart so the path of least....
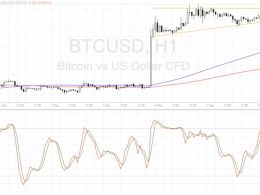
Bitcoin price is still moving in tight consolidation, but this appears to be a continuation signal from the previous strong move. Bitcoin Price Key Highlights. Bitcoin price is still stuck in consolidation, as traders are waiting for bigger market catalysts before deciding which direction to take. Keep in mind that bitcoin just recently made a strong rally, which makes the consolidation pattern a bullish flag. Technical indicators seem to be suggesting that an upside breakout is likely. Technical Indicators Signals. The 100 SMA is above the longer-term 200 SMA on this time frame,....
Bitcoin price looks ready to break out of its symmetrical triangle consolidation pattern, which could determine its longer-term direction. Bitcoin Price Key Highlights. Bitcoin price has been stuck in consolidation for a while, forming lower highs and higher lows inside a symmetrical triangle pattern. Price is currently testing support and is approaching the peak of the pattern, which suggests that a breakout could take place soon. Technical indicators seem to be favoring a downside move at this point. Technical Indicators Signals. The 100 SMA is still below the 200 SMA so the path of....

Ethereum Price Key Highlights. Ethereum price is still slowly climbing, transitioning into a rising wedge formation from an earlier ascending channel. Price bounced off the mid-channel area of interest as predicted in an earlier article, reflecting increased bullish pressure. With the consolidation getting tighter and ethereum price approaching the peak of the wedge, a breakout in either direction is imminent. Waiting for Bitcoin Breakout? Bitcoin is also stuck in a consolidation pattern, as traders are probably on the lookout for more catalysts. This has kept ethereum price in....