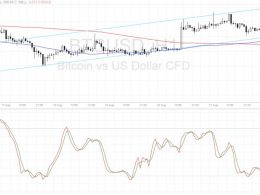
Bitcoin Price Technical Analysis for 04/07/2016 – Ready to Test Support
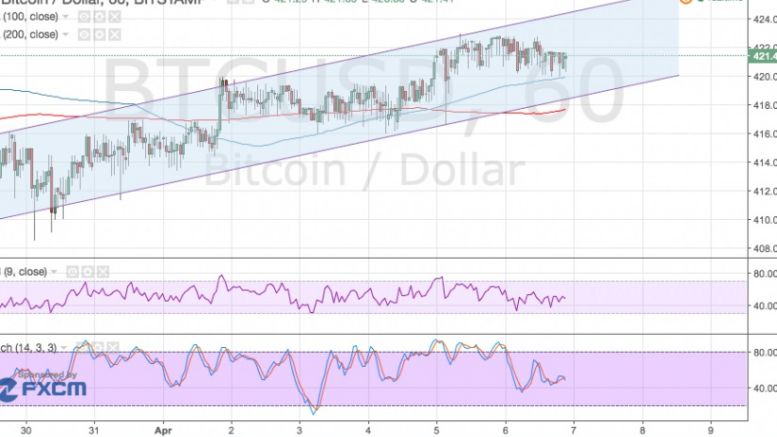
Bitcoin price is gearing up to test the channel support near $417-420 and might be due for another bounce. The 100 SMA is safely above the longer-term 200 SMA so the path of least resistance is to the upside. This confirms that a bounce off support is likely to take place, as this area also coincides with the 200 SMA dynamic inflection point. However, stochastic is on the move down, indicating that bitcoin price might follow suit. RSI is moving sideways so consolidation could be in play. Still, a strong return in buying pressure could lead to another test of the resistance around $425 or....
Related News
Bitcoin price could be ready to test the bottom of the rising channel, which lines up with several inflection points. Bitcoin Price Key Highlights. Bitcoin price bounced off the bottom of its short-term ascending channel and climbed to the top. The channel resistance kept gains in check, putting bitcoin back on track towards testing support again. Technical indicators are showing that the uptrend could continue but that a pullback might be in the cards. Technical Indicators Signals. The 100 SMA is still above the 200 SMA so the path of least resistance is to the upside, which means that....

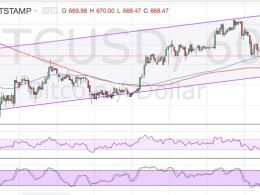
Bitcoin price could be ready to resume its climb now that this area of interest held as support. Bitcoin Price Technical Analysis. Bitcoin price recently made an upside breakout from a near-term resistance around $660. Price has found resistance at the $670 area and has since pulled back to the broken resistance, which appears to have held as support. This signals that bitcoin bulls could be ready to charge once more, although technical indicators are suggesting otherwise. Technical Indicators Signals. The 100 SMA is still below the longer-term 200 SMA so the path of least resistance is to....
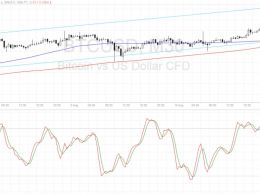
Bitcoin price could be due for a test of the ascending channel resistance visible on its 1-hour time frame. Bitcoin Price Key Highlights. Bitcoin price recently sold off but found support around the $650 area as predicted in an earlier article. This was in line with the 200 SMA, which held as a dynamic support level. Bullish pressure seems to be building up again as an ascending channel is forming. Technical Indicators Signals. Bitcoin price made a quick spike on its test of the channel support, indicating that buyers are putting up a fight and ready to push price back up to the top of the....
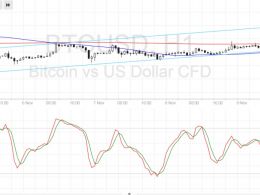
Bitcoin price is settling inside a new rising channel on its 1-hour time frame and might be due for a test of support soon. Bitcoin Price Key Highlights. Bitcoin price is trending higher on its 1-hour time frame, moving inside an ascending channel pattern. Price just bounced off the resistance and is making its way back towards support. Technical indicators are suggesting that the uptrend could carry on, possibly leading to another test of the channel resistance. Technical Indicators Signals. The 100 SMA is below the longer-term 200 SMA for now so the path of least resistance is to the....
Bitcoin price could be ready for another bounce off the channel support as the bullish trend goes on. Bitcoin Price Key Highlights. Bitcoin price is still inside that ascending channel on its 1-hour time frame, bouncing off support as suggested in the earlier article. Price just got rejected on its test of the channel resistance once more, putting it back on track towards testing support. Technical indicators are suggesting that a pullback could take place but that the bullish trend could continue. Technical Indicators Signals. The 100 SMA is above the longer-term 200 SMA so the path of....