Ethereum Price Technical Analysis – New Weekly Low In Making
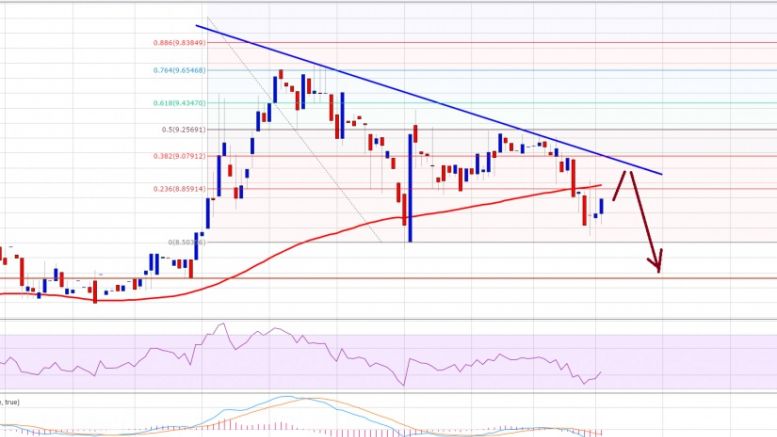
Ethereum price is looking negative for today. If the trend line resistance holds, ETH/USD may move down and trade near $8.25. Ethereum price ETH managed to move higher once again yesterday, but faced offers near the $9.10-20 resistance area. Yesterday, I highlighted a bearish trend line on the hourly chart (data feed via Kraken) of ETH/USD, and suggested a buy if the price moves above it. There was no upside break, but on the other hand, the price moved down after testing trend line resistance. The most important point is that ETH failed near the 50% Fib retracement level of the last drop....
Related News

A crypto analyst, who publishes technical analysis to his audience on X, has released a zoomed-out weekly Ethereum chart that interprets the current price weakness as the final stage of a multi-year accumulation cycle. As it stands, the Ethereum price is trading around $2,100 and 57% below its peak. Therefore, the technical analysis is suggesting that […]

The price of Ethereum (ETH) has struggled to hold above $2,000 against Tether (USDT) after being rejected from that region. Ethereum price in the past few days has struggled to reclaim the $2,000 mark that has become a resistance despite showing strong bullish signs and outperforming Bitcoin (BTC) in this relief rally. The price of ETH ranging has led to many feeling weary if bulls are still in control. Related Reading: Shiba Inu Trends Upwards Through Strong Whale Accumulations Ethereum (ETH) Price Analysis On The Weekly Chart From the chart, the price of ETH saw a weekly low of $1,012,....

Bitcoin has failed to latch onto the weekly high of $466.64, coming down swiftly to $442.38 in a week dominated primarily by the first US interest rate hike in almost a decade. Interestingly, the cryptocurrency failed at the same level in the previous week also. As the week comes to a close on a relatively weak note, it might provide the bears with a much-needed impetus to make Bitcoin less expensive. Image. We will discuss today the weekly BTC-USD price chart from the Bitstamp exchange. The picture is very similar to what we observed in the previous weekly price technical analysis of....
The price of Ethereum (ETH) showed so much strength but has been hit with resistance against Tether (USDT) as the Ethereum merge is announced. Ethereum price rallied with so much strength from a region of $1,670 to $1,924, as bulls anticipate the Ethereum merge from proof-of-work (POW) to proof-of-stake (POS). Related Reading: Will Ethereum Breach $2,000 Before The Merge? Ethereum merge is an upgrade on the Ethereum network from POW to POS so as to increase its network efficiency in transactions. (Data feeds from Binance) Ethereum Price Analysis On The Weekly Chart From the chart, the....
The price of Ethereum (ETH) has struggled to hold above $2,000 against Tether (USDT) after being rejected from that region. Ethereum price in the past few weeks outperformed the price of Bitcoin (BTC) but has shown bearish signs indicating the ETH price could be set to retest the nearest support. Related Reading: TA: Ethereum Could Take Hit As The Bulls Show Weak Hands Ethereum (ETH) Price Analysis On The Weekly Chart From the chart, the price of ETH saw a weekly low of $1,700, which bounced from that area and rallied to a price of $2,030 after showing great recovery signs in recent....