Ethereum Price Technical Analysis – Perfect Sell & Consolidation
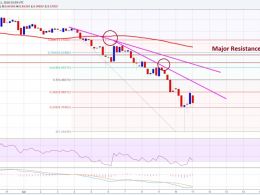
Ethereum price hit the final sell target of $8.00. Moving ahead, it is wise to wait for the next move as there may be a minor consolidation underway. Ethereum price ETH moved just as forecasted in my yesterday’s post in which I stated that there is a chance of the price moving down close to the $8.00 level. There was a downside thrust, and ETH/USD formed a yet another weekly low below $8.00. However, the bears need to be very careful in the short term, as there is a possibility that ETH may move in a range for a few hours before deciding the next move. I prefer not to trade when the market....
Related News
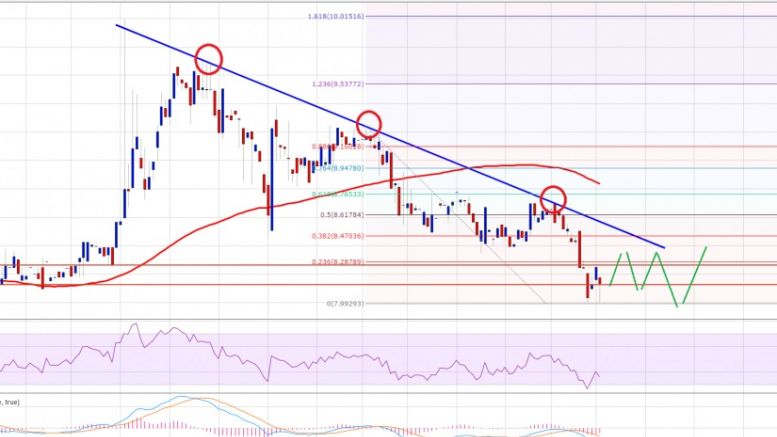
Ethereum price tumbled recently, and traded towards $8.00. It was a perfect sell, and it looks like the bulls may be exhausted. Ethereum price ETH was down and out, as there was a sharp downside move towards the $8.00 support area. I mentioned in my previous analysis that there is a chance of a decline in ETH/USD due to the technical indicators. It was a perfect sell, and the final target of $8.0 was achieved. There was a bearish trend line on the hourly chart (data feed via Kraken) of ETH/USD, which acted as a perfect catalyst for a decline. The price traded below $8.0, and a new low of....
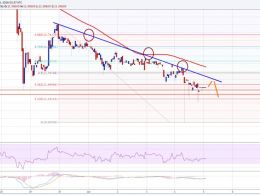
Ethereum price spiked down to complete a downside thrust against the US Dollar. Can it recover or will it continue to trade down? Key Highlights. Ethereum price collapsed against the US Dollar and even created a new low below $11.00 (as per Kraken data feed). Yesterday’s bearish trend line on the hourly chart (data feed via Kraken) of ETH/USD acted as a perfect resistance and pushed the price down. The price after trading below $11.00 recovered well and currently above the $11.20 support area. Ethereum Price Resistance. Ethereum price continued to move down versus the US Dollar, as the....
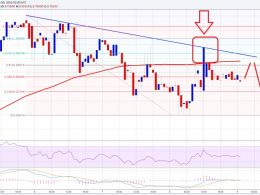
Ethereum price spiked higher yesterday. However, the price found sellers around a perfect sell zone and moved down once again. Intraday Support Level can be $9.20. Intraday Resistance Level may be $10.60. Ethereum price after moving down towards $8.50 managed to gain bids and traded back higher. However, I highlighted in yesterday’s post that if the price jumps higher, then we can consider selling near a bearish trend line formed on the hourly chart (data feed via Kraken). The highlighted trend line and resistance area acted as a perfect hurdle for the bulls and pushed the price back....
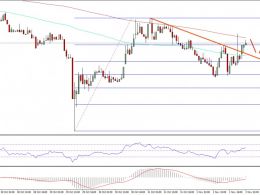
Ethereum price after a minor dip yesterday against the US Dollar found support, and ETH/USD currently looks set for more upsides in the near term. Key Highlights. ETH price after trading as low as $10.28 against the US Dollar yesterday started a recovery. There was a bearish trend line formed on the hourly chart (data feed via SimpleFX) of ETH/USD, which was broken to open the doors for more gains. The price bounced from a perfect technical support area, suggesting the price may gain further. Ethereum Price Bullish Move. ETH price after trading as high as $11.35 started a correction phase....
Ethereum price was a perfect sell intraday as forecasted. It looks like there is a room for another downside move if all goes well. Intraday Support Level can be $10.00. Intraday Resistance Level may be $12.50. Ethereum price was aligned for a short-term downside move, as forecasted in yesterday’s post. I forecasted selling near a major resistance area, which was formed near a bearish trend line on the hourly chart (data feed via Kraken). The trend line resistance area acted as a perfect barrier and pushed the price down to hit all our sell targets. Now what? I think the price has started....

