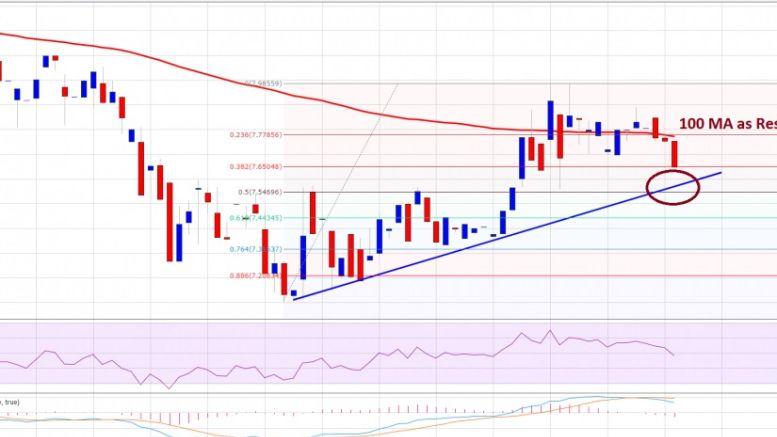
Ethereum Price Technical Analysis – 100 SMA As Significant Resistance
Ethereum price recent correction looks impressive. However, ETH/USD needs to clear 100 hourly SMA to gain further strength. Ethereum Price – Can Trend Line Hold? Ethereum price ETH finally showed some signs of life and moved higher after trading towards $7.00. There was a nice upside reaction, but the price found offers near the 100 hourly simple moving average. There was no proper hourly close above the 100 SMA, which can be seen as a concern for the ETH bulls. Moreover, the price failed to break the $8.00 resistance area as well, which is another negative sign. However, there is a hope....
Related News

Ethereum has finally crossed over the downward sloping resistance line, albeit on a low volume, which fails to induce any confidence in the breakout. As can be seen from the 2-hour ETH-XBT price chart taken from Kraken exchange, there is no visible surge in volume reading even after the resistance has been taken out. A major contribution in ETH/XBT price rise is the sudden collapse in Bitcoin price. A free falling Bitcoin will aid this pair. Ethereum is currently trading at 0.00240BTC. The technical picture suggests that Ethereum will face significant selling pressure 0.00283BTC even if....

Ethereum is trading very flat in a dull session as bitcoin remains undecided about the future direction. Currently at 0.00191BTC, Ethereum is in a no trade zone as discussed in the previous technical analysis. Sole Positive – The technical indicators are, however, rebounding from the respective oversold levels. I would like to discuss the resistance and support levels for Ethereum now. To serve this purpose, I will be using the 4-h ETH-XBT pair. Chart Structure – The pair has been registering lower tops and lower bottoms for the past 10 trading sessions. Connecting the two highs in this....

Litecoin continues to tire out below the previous resistance level of $3.050 but, unfortunately, it has made no significant attempt which would induce fear in the hearts of short sellers. The price trades in an extremely tight range near the highs, making it difficult for the trading community to place their positions at low risks. Litecoin is currently trading down 1.58% at $2.971 and has hit a low of $2.950. Technical analysis implemented on the 240-minute LTC-USD price chart indicates that the traders must remain patient as a breakout/breakdown is around the corner. Litecoin Chart....

Ethereum Price Key Highlights. Ethereum price has been on a downtrend on its longer-term time frames, but it looks like the tides could turn. A double bottom pattern is visible on the 4-hour chart and price is making its way up to test the neckline at 0.0040. Ethereum price could be in for a long-term uptrend if it is able to break past the neckline resistance soon. Technical Indicators In Favor Of the Bulls. The technical indicators on the 4-hour time frame support further gains in ethereum price, as the 100 SMA just crossed above the 200 SMA. This signals that the path of least....

Ethereum has started to show signs of life again after weeks of muted price action, but one analyst believes the current move is only the beginning of something much larger. This inclination is based on a technical setup built around a hidden inefficiency zone after the Ethereum price recently broke above $4,500. The technical analysis shows that the unfilled gap may be the first waypoint in a recovery that eventually pushes the ETH price to five figures above $10,000. The FVG Zone Now Acting As A Magnet Technical analysis done by crypto analyst Crypto Patel laid out a path to where the....