Litecoin Price Technical Analysis – Perfect Sell and Downside Move
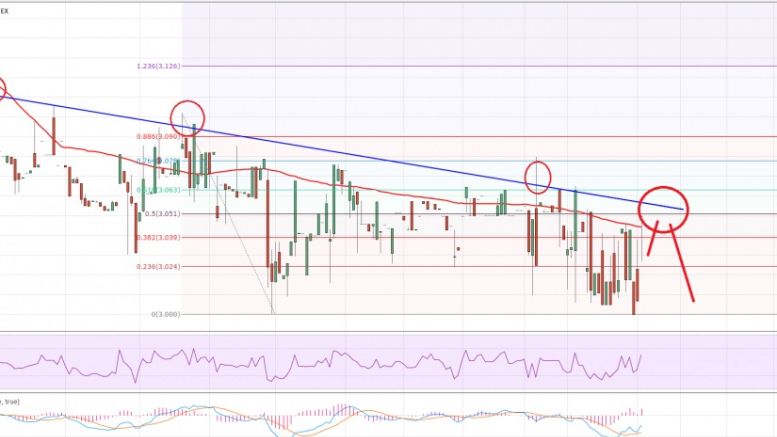
Litecoin price failed to trade higher. Our sell idea on the 30-min chart was a perfect deal as the price moved down towards $3.00. A Support Level (HitBTC) can be at $3.03. An important Resistance Level (HitBTC) may be $3.18. There were a few bearish signs noted on the 30-mins chart (data feed via Bitfinex) for Litecoin price, which played well and pushed the price down. There was a bullish trend line, which was broken to ignite a bear rally. Now, there is a bearish trend line formed on the same chart that acted as a barrier for buyers on many occasions, and it looks like there is a chance....
Related News
Ethereum price tumbled recently, and traded towards $8.00. It was a perfect sell, and it looks like the bulls may be exhausted. Ethereum price ETH was down and out, as there was a sharp downside move towards the $8.00 support area. I mentioned in my previous analysis that there is a chance of a decline in ETH/USD due to the technical indicators. It was a perfect sell, and the final target of $8.0 was achieved. There was a bearish trend line on the hourly chart (data feed via Kraken) of ETH/USD, which acted as a perfect catalyst for a decline. The price traded below $8.0, and a new low of....

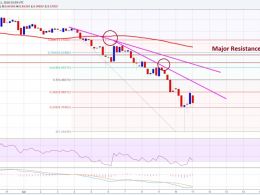
Litecoin price fell further and traded towards our final sell target. Moving ahead, a short-term recovery is possible as the price is approaching a critical support. Litecoin price headed down yesterday, as seller remained in action and buyers failed to hold the downside break. Out long followed bearish trend line on the hourly chart (data feed from Bitfinex) continued to play a major role and ignited a solid downside move. As can be seen from the chart attached, there were more than 4 attempts to break the highlighted trend line and resistance area, but buyers failed.
Litecoin price stalled around the $3.30 area. It is currently under a lot of bearish pressure that could result in a sharp downside move. Major Support Level (HitBTC) can be $3.10. Crucial Resistance Level (HitBTC) may be $3.18. Litecoin price after trading as high as $3.20 (data feed via Bitfinex) found resistance and started to move down. There was a lot of selling pressure noted, which resulted in a continuous downside move. There is a bearish trend line formed on the 30-min chart (data feed via Bitfinex), as highlighted in this past week’s analysis. We sold a couple of times around the....
Litecoin Price Key Highlights. Litecoin price is consolidating tightly on its 1-hour time frame, finding resistance at 3.320 and testing support at 3.215. Further consolidation might be likely, as technical indicators are barely offering strong directional clues at the moment. A downside break from the current range of litecoin price could lead to a move down to the next floor at 3.150. Two Ranges Present. Litecoin price appears to be pressing down on the bottom of the range, as it has formed lower highs since late last week. This suggests that bearish momentum is building up and sellers....

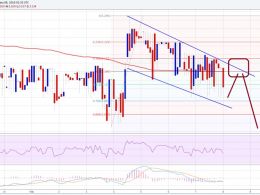
Litecoin price failed to hold gains, and started to fall. It looks like there is a chance of a dip towards the $3.00 support area moving ahead. Selling rallies can be preferred. Intraday Support Level (Bitfinex) may be at $3.00. I forecasted in yesterday’s post that there is a chance that the price may trade lower and test the channel support trend line formed on the hourly chart (data feed via Bitfinex). The price did move down, but even managed to clear the channel support area, which ignited a downside reaction. If someone followed our idea, then I think it’s time to take profits and....